Overview
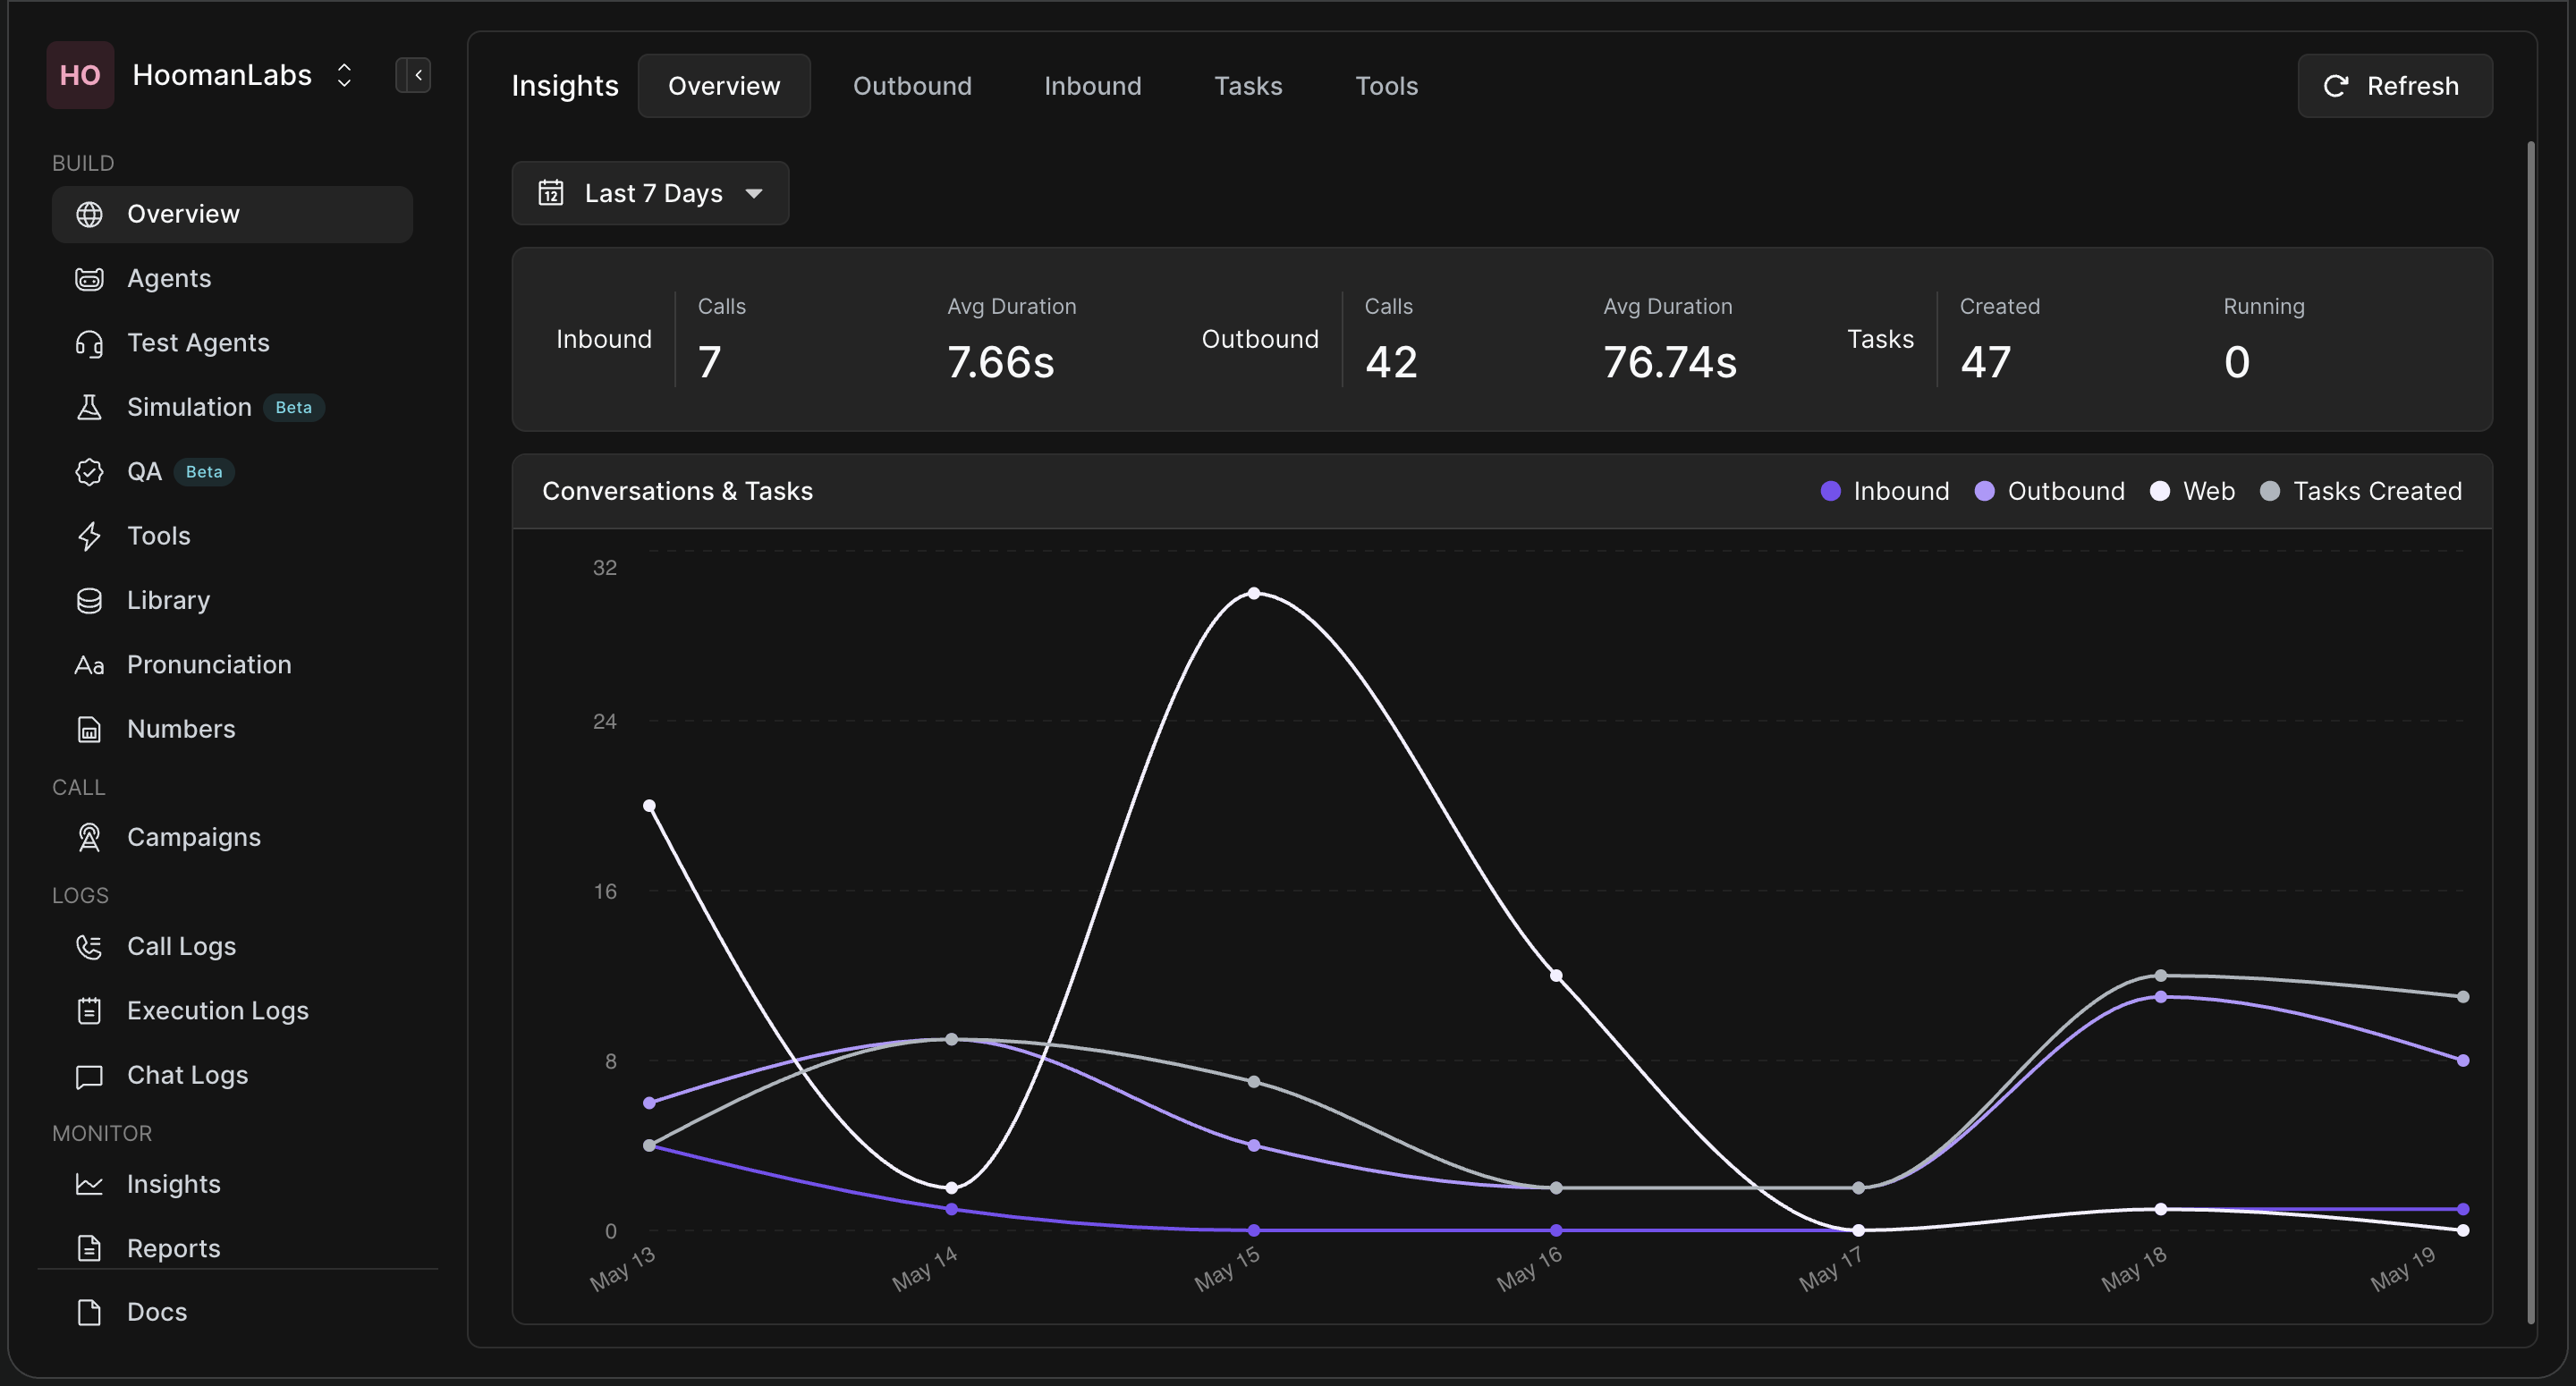
The Overview tab provides a high-level summary of all platform activity.
-
Quick Stats: Instantly view the total number of inbound calls, outbound calls, and active tasks alongside their average durations.
-
Time Filtering: By default, data is shown for the last 7 days. Use the date picker in the top left to adjust this range.
-
Visual Trends: The primary line graph visualizes inbound, outbound, and web interactions, as well as the number of tasks created over your selected time period.
2. Outbound Tab
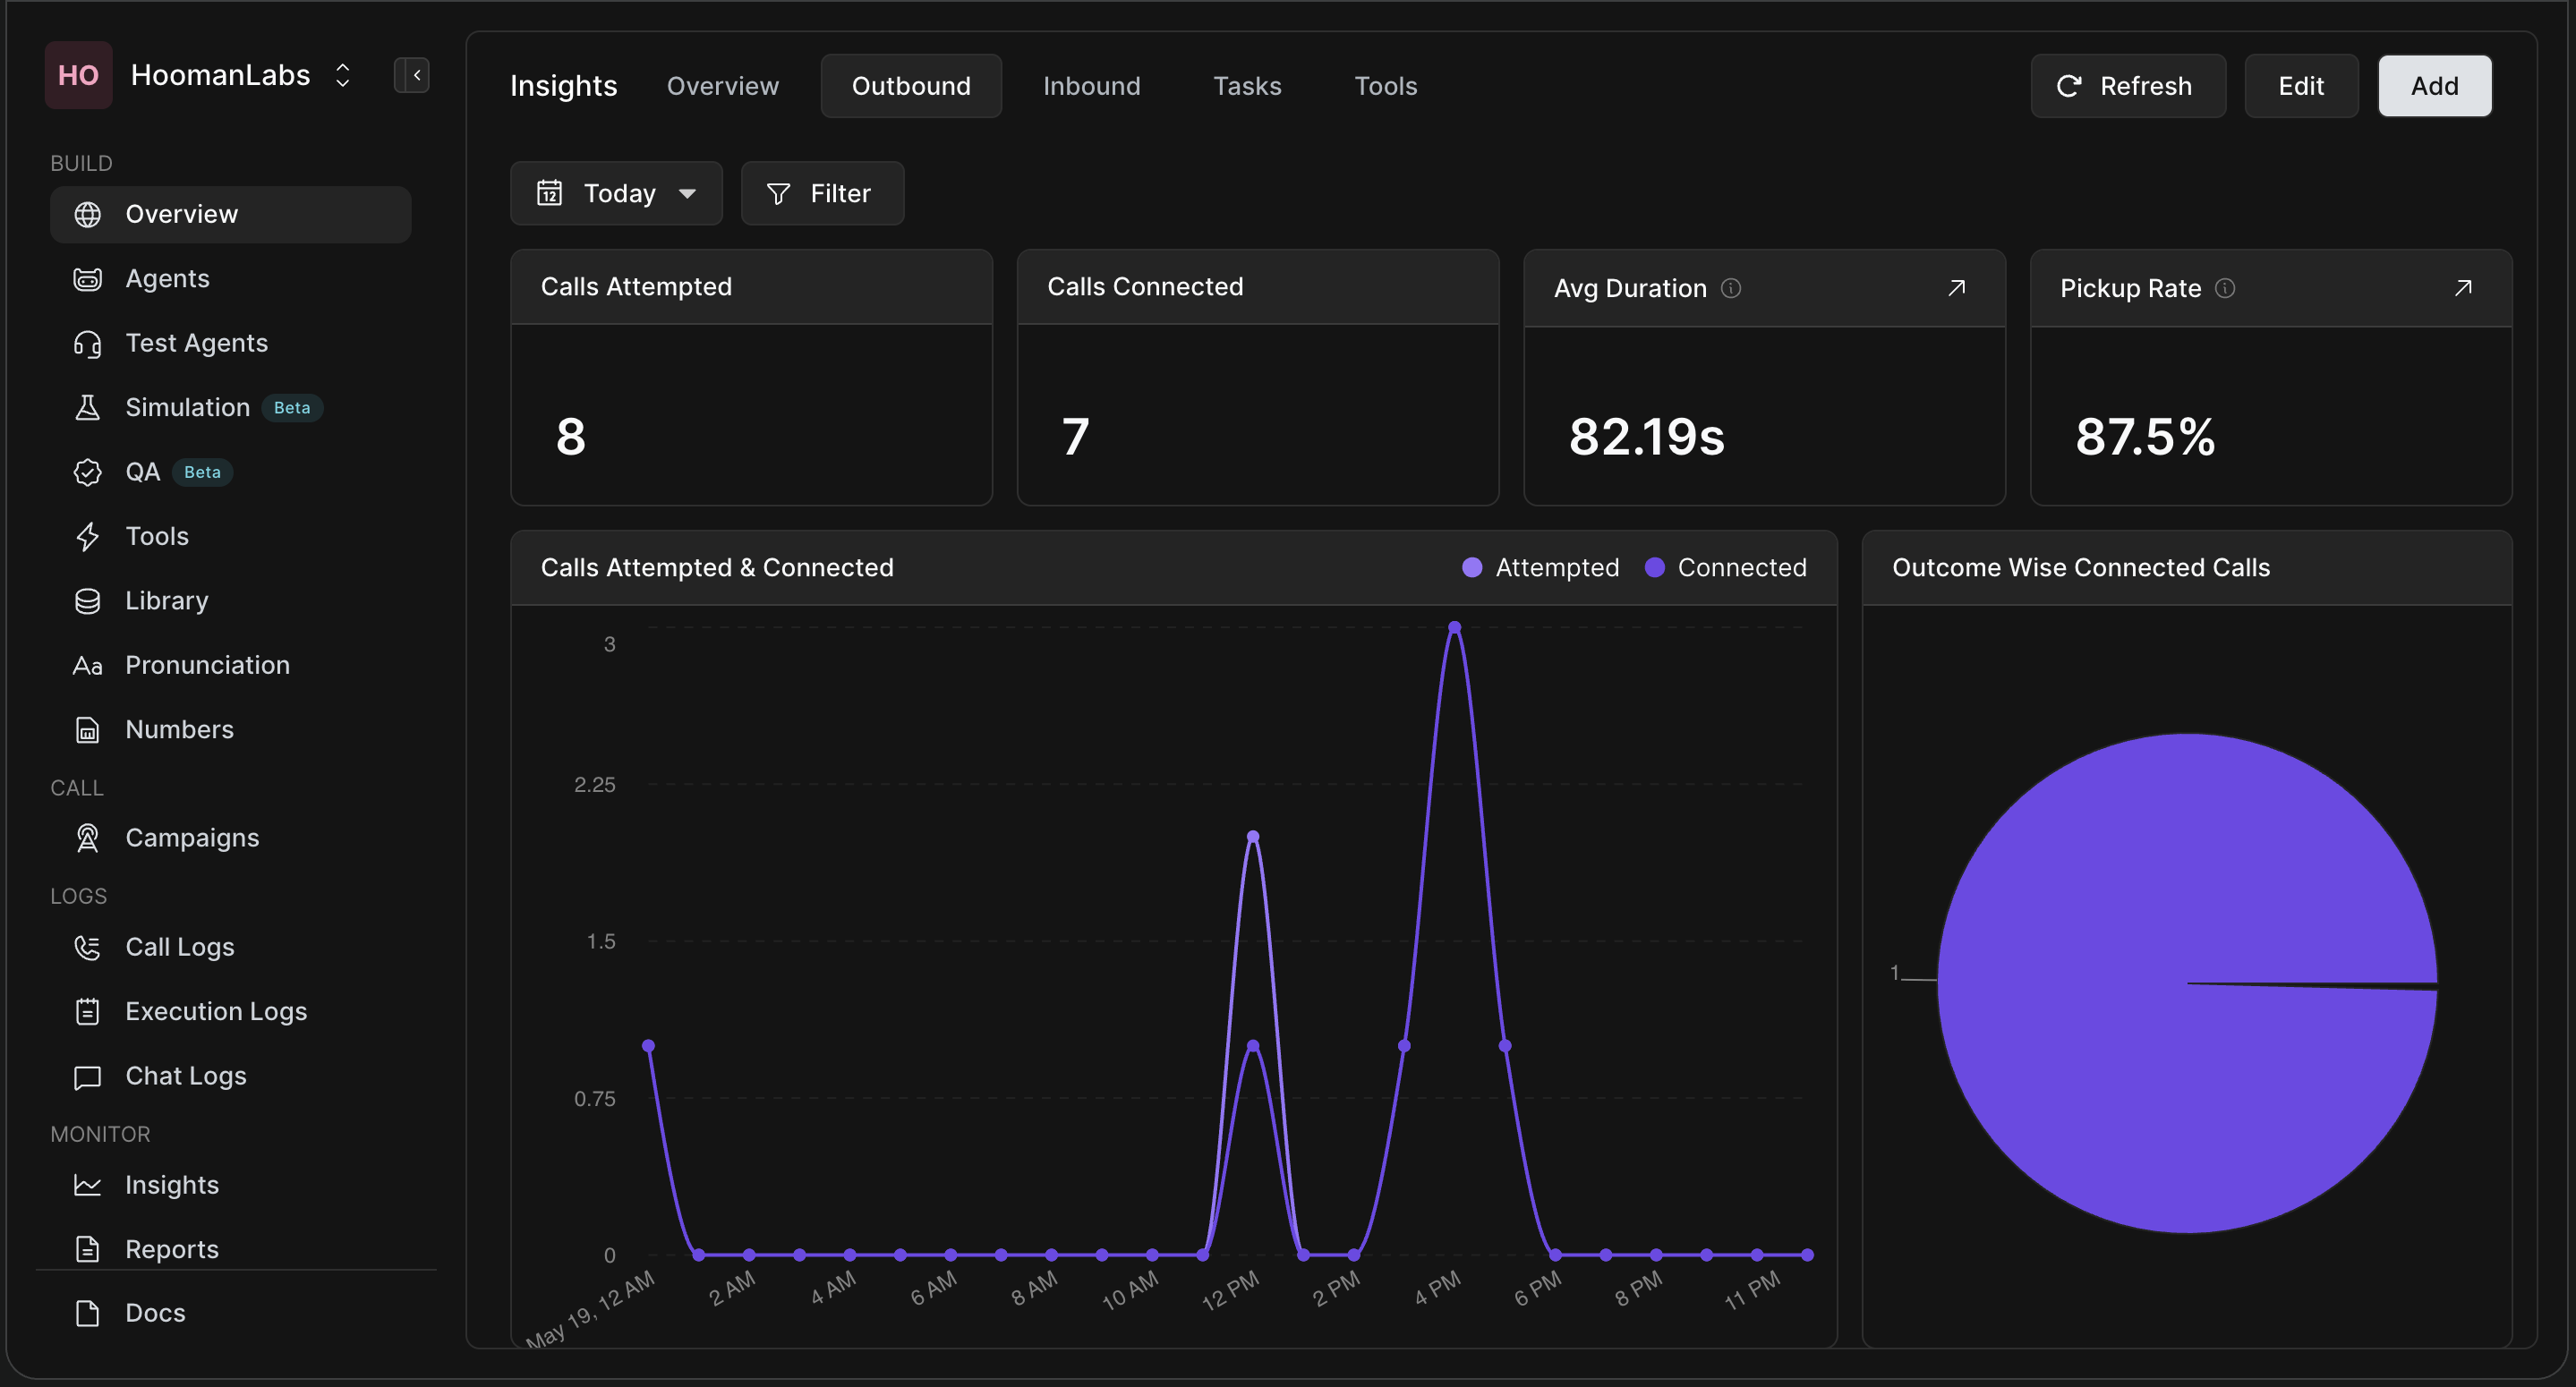
The Outbound tab offers a granular look into calls initiated by your agents.
-
Key Metrics: Track Calls Attempted, Calls Connected, Average Duration, and the overall Pickup Rate.
-
Outcome Visualizations: Pie charts break down connected calls by their specific outcomes (e.g., successful booking, callback requested, user busy).
-
Agent-Level Data: Tables at the bottom of the page display performance per agent. You can see exactly which agents are driving the most volume.
-
Data Export: You can download the data from these tables for external reporting purposes.
-
Deep Dives: Click the arrow icon on specific widgets (like Average Duration or Pickup Rate) to drill down further—such as viewing picku
3. Inbound Tab
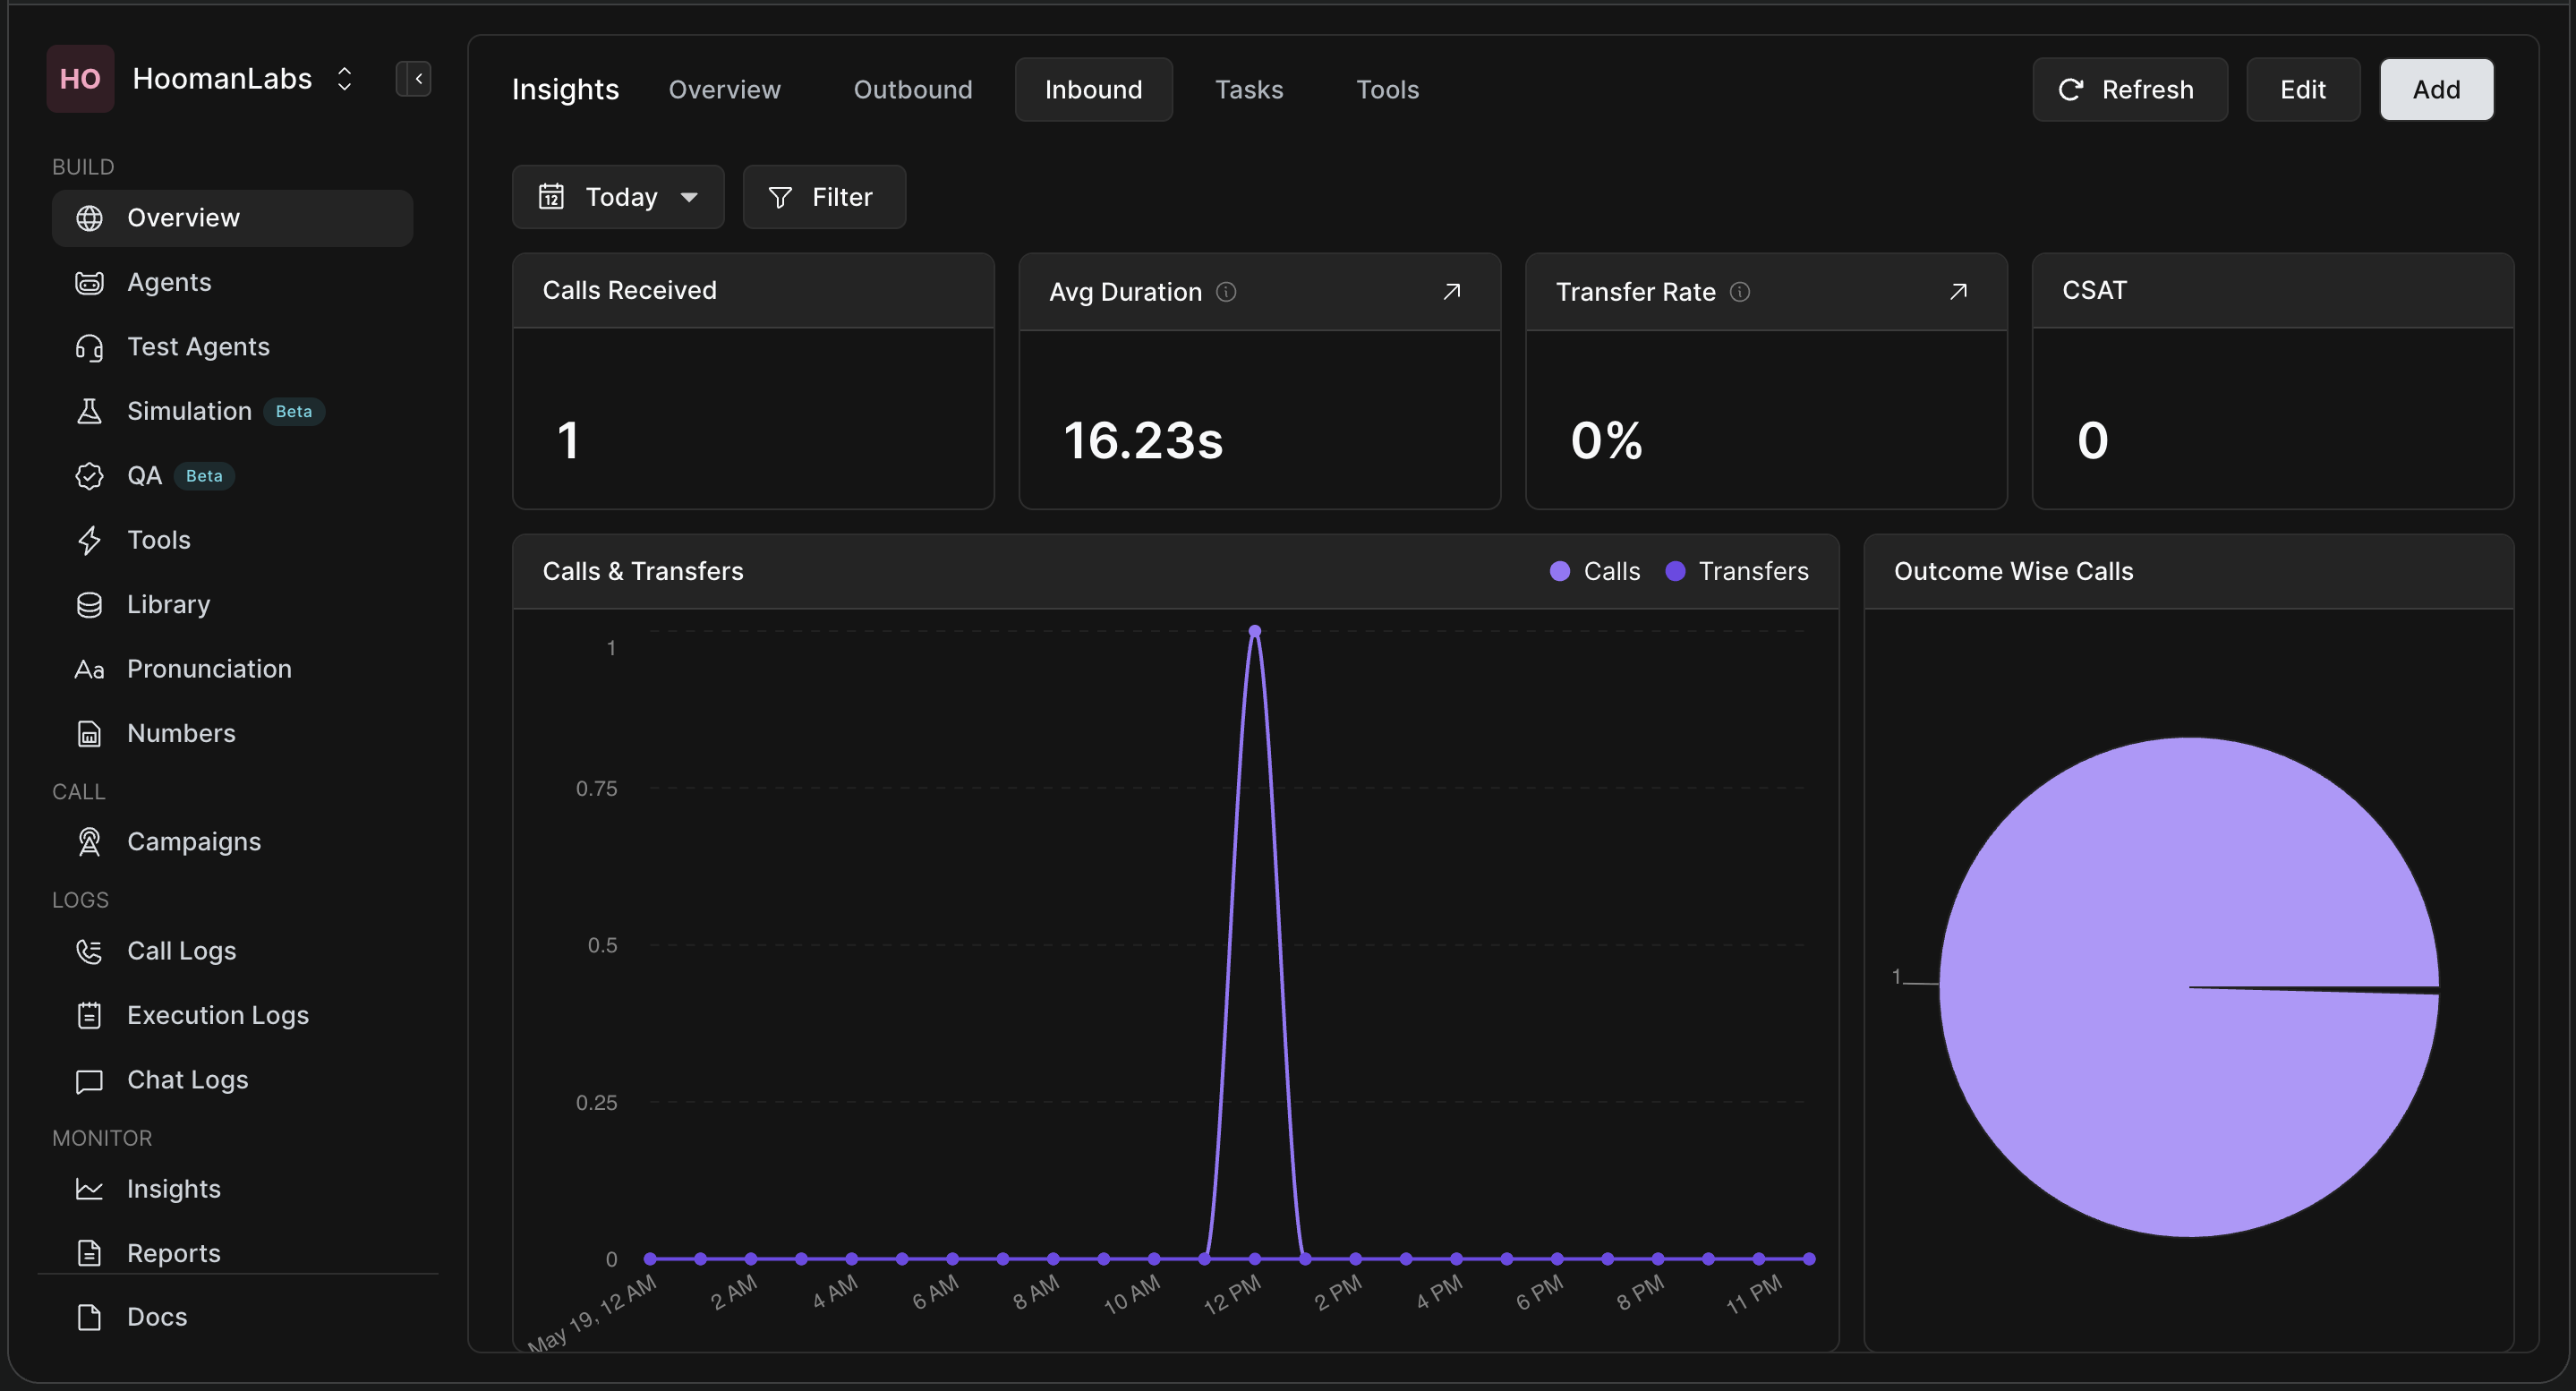
Similar to the Outbound dashboard, the Inbound tab tracks calls received by your agents.
-
Key Metrics: Monitor Calls Received, Average Duration, Transfer Rate (calls escalated to a human), and CSAT (Customer Satisfaction scores, if applicable).
-
Visual Tracking: Keep an eye on peak call hours using the main line graph and view call outcomes via the pie charts.
4. Tasks Tab
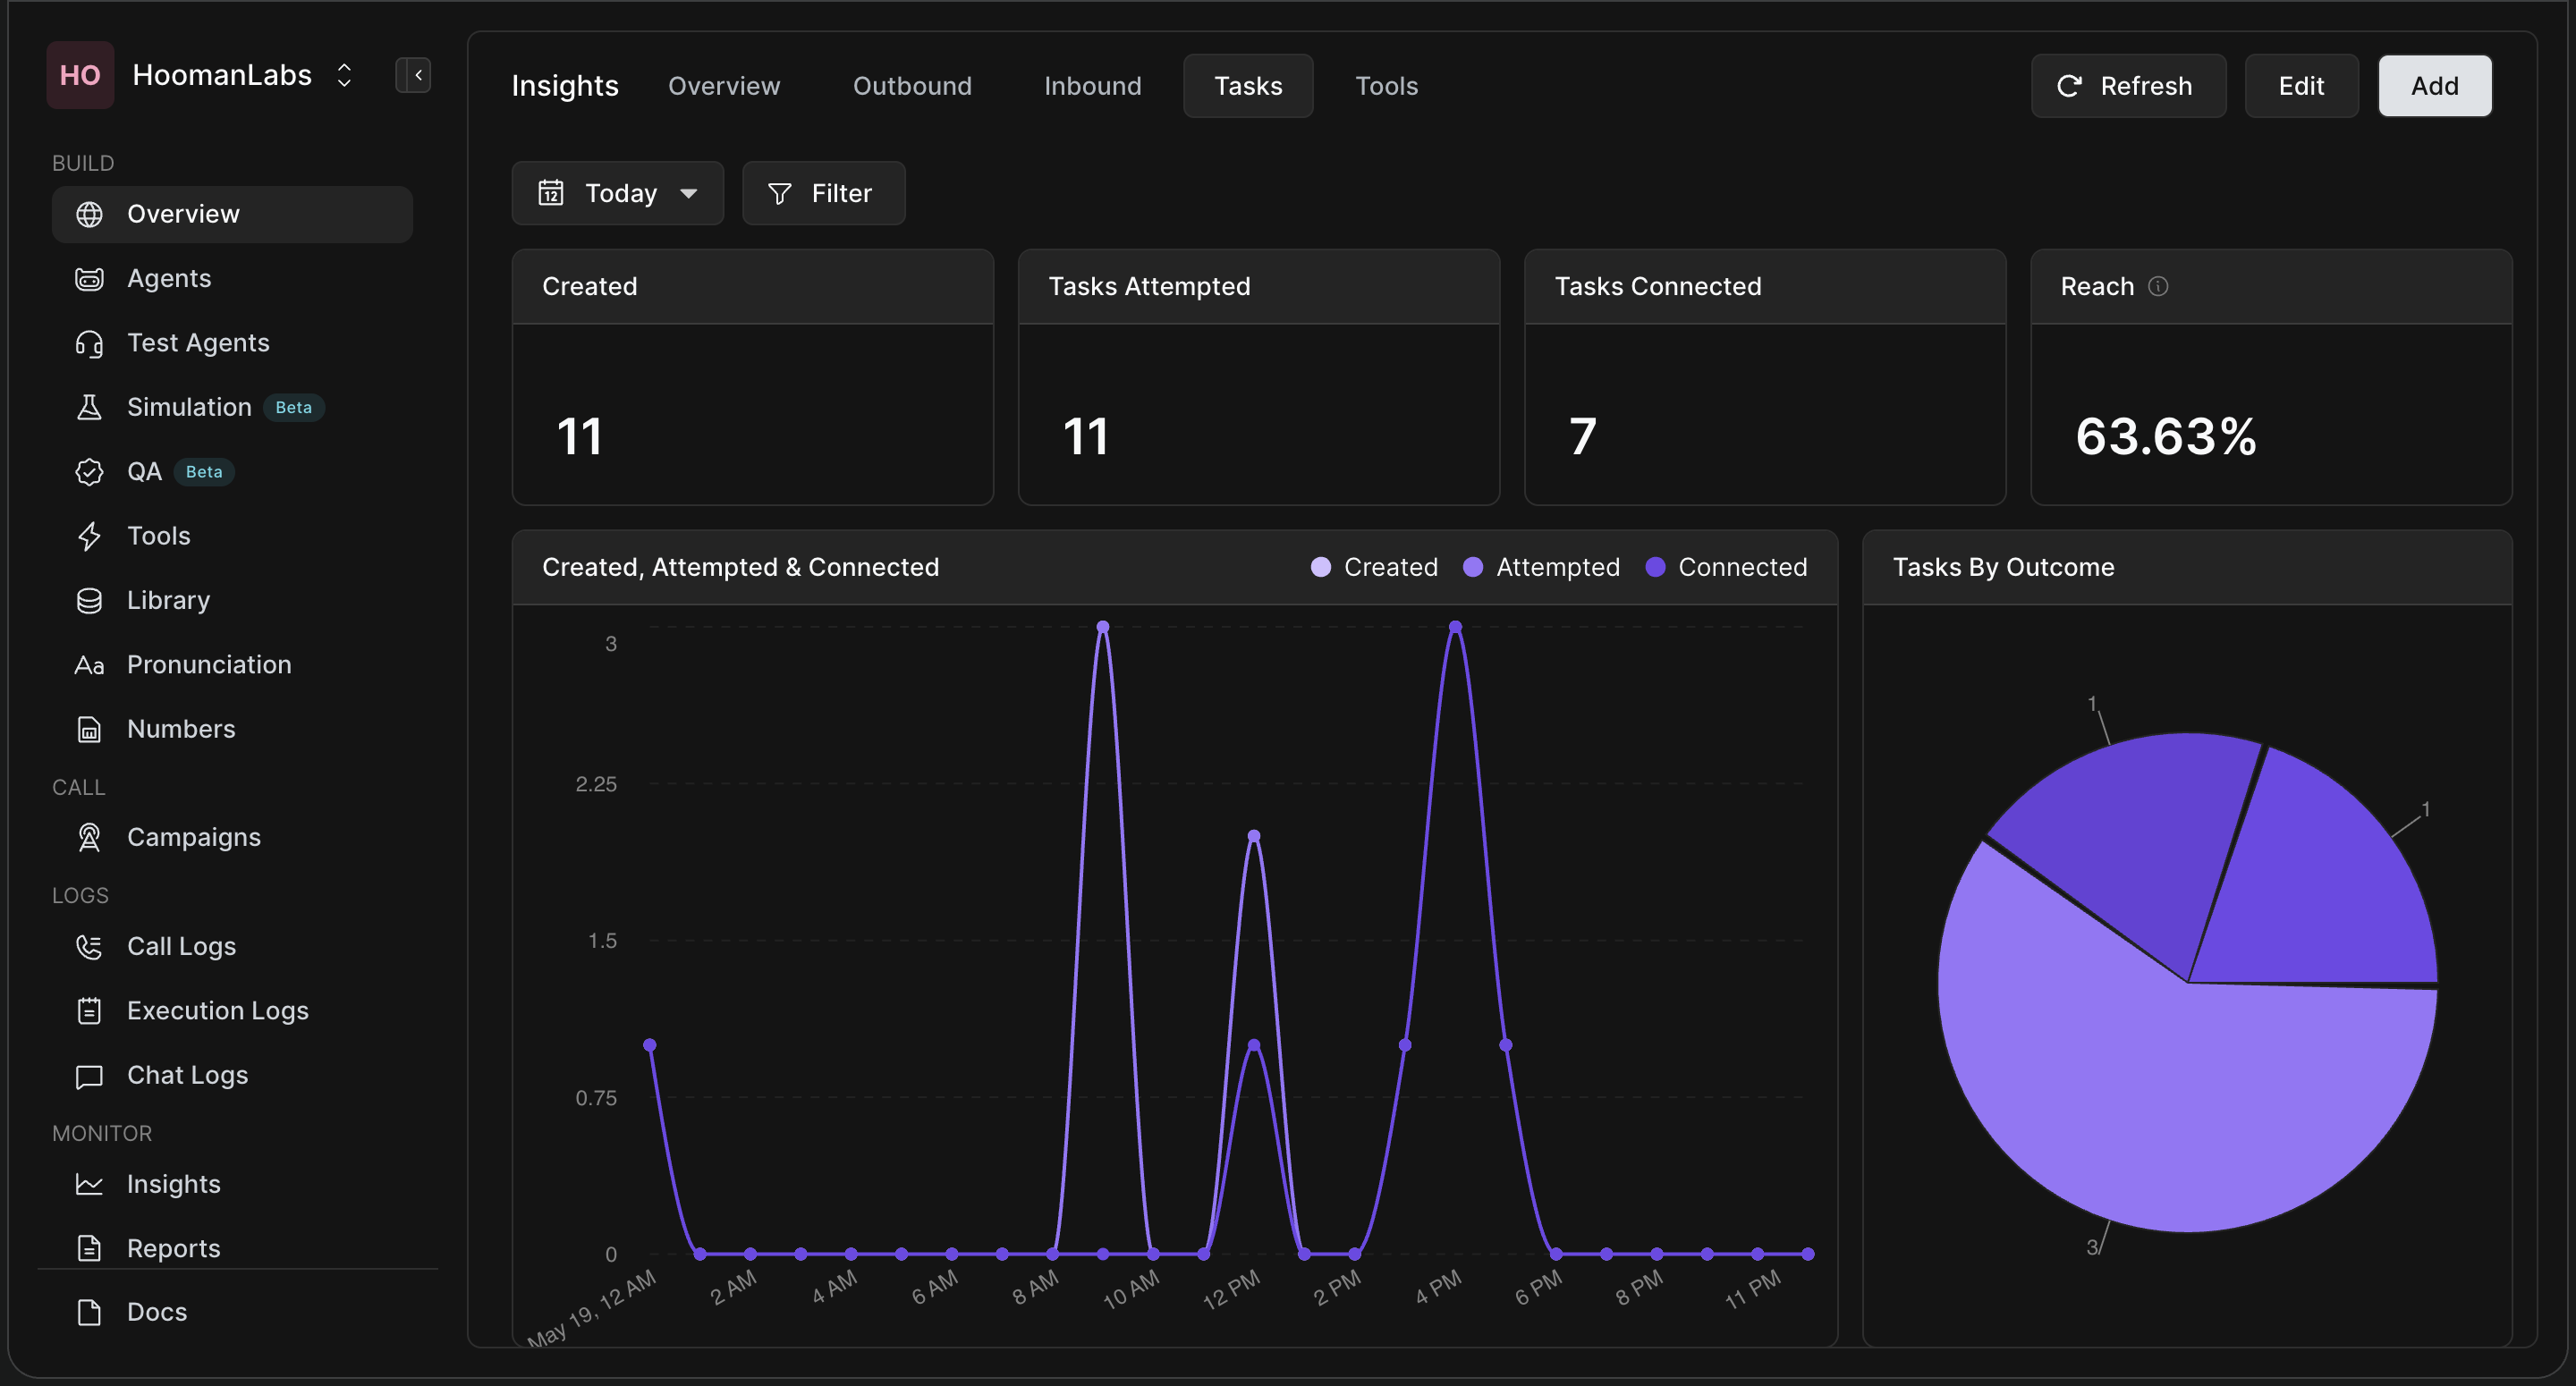
It is crucial to understand the difference between Outbound metrics and Tasks metrics.
-
Outbound = Call Level: If you create a task with 3 retry attempts, and the system calls the user 3 times, the Outbound tab registers this as 3 separate calls.
-
Tasks = Lead Level: The Tasks tab tracks unique individuals. If you upload a list of 100 leads, your task count is 100.
-
The "Reach" Metric: This tab introduces Reach, which represents the percentage of unique people successfully contacted, regardless of how many retry attempts it took. Even if your overall pickup rate on the Outbound tab is 40%, your Reach on the Tasks tab might be much higher because of follow-up attempts.
5. Tools Tab
The Tools tab tracks the performance of the external APIs, webhooks, and tools your agents rely on during conversations.
-
Usage Summary: See which tools are being called and how frequently.
-
Health Tracking: Monitor the success and failure rates of tool executions to ensure your backend integrations are functioning smoothly.