Quality Analysis (QA)
Overview
The QA module empowers you to automatically evaluate your AI agents' call transcripts against custom-defined metrics. By leveraging LLM-based judges, you can monitor conversation quality, identify regressions, and ensure your agents adhere to specific guidelines and best practices.
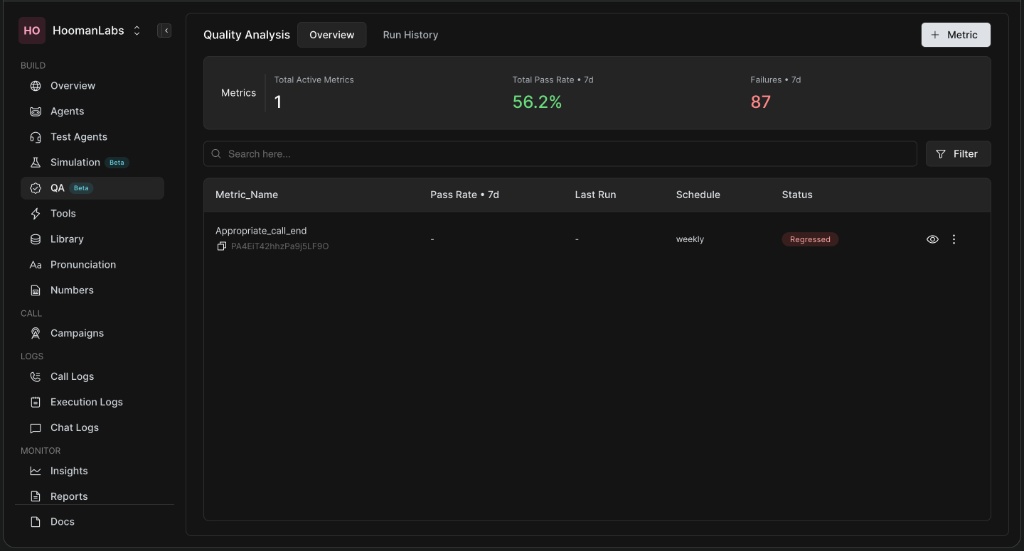
Key Elements:
-
Total Active Metrics: The number of metrics currently running.
-
Total Pass Rate: The aggregated pass rate across all metrics over a specified timeframe (e.g., 7 days).
-
Failures: The total number of failed evaluations.
-
Metrics Table: A quick view of each metric's pass rate, last run schedule, and current status (e.g., Regressed).
Creating a New Metric
Name
Use a clear, specific name that reflects what the metric measures (e.g., Issue Resolved, Policy Compliance, Customer Sentiment).
Description
Explain in simple terms what the metric evaluates and what each possible output means. Clear definitions improve scoring consistency. Define the scale (min-max) and what low vs. high scores mean.
To evaluate a specific behavior (e.g., "Appropriate Call End"), you need to create a metric. The creation process is divided into four distinct steps.
Step 1: Define
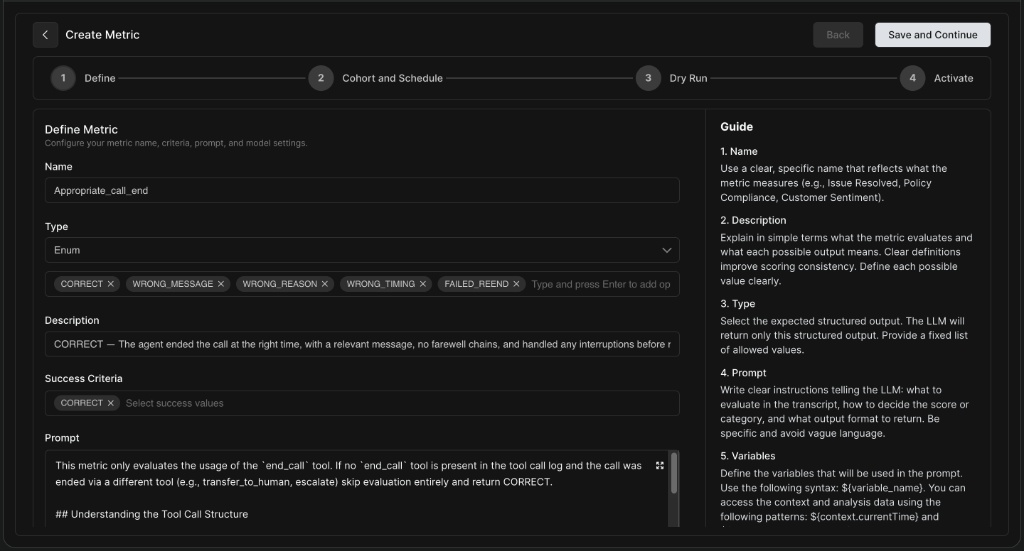
The Define step is where you tell the LLM exactly what to evaluate.
-
Name & Description: Give your metric a clear, identifiable name and explain what it evaluates to ensure scoring consistency.
-
Type: Select the expected structured output. For categorical evaluations, use Enum.
-
Enum Options: Define the possible output values (e.g.,
CORRECT,WRONG_MESSAGE,WRONG_TIMING). -
Success Criteria: Specify which of your Enum values constitute a "pass" or successful interaction.
-
For Boolean, success criteria would be either true or false.
-
For Number, you can set a particular minimum and maximum critera as your success criteria
-
Prompt: Write clear instructions telling the LLM what to look for in the transcript and how to decide the score. You can use provided variables like
${variable_name}to inject context dynamically.
Step 2: Cohort and Schedule
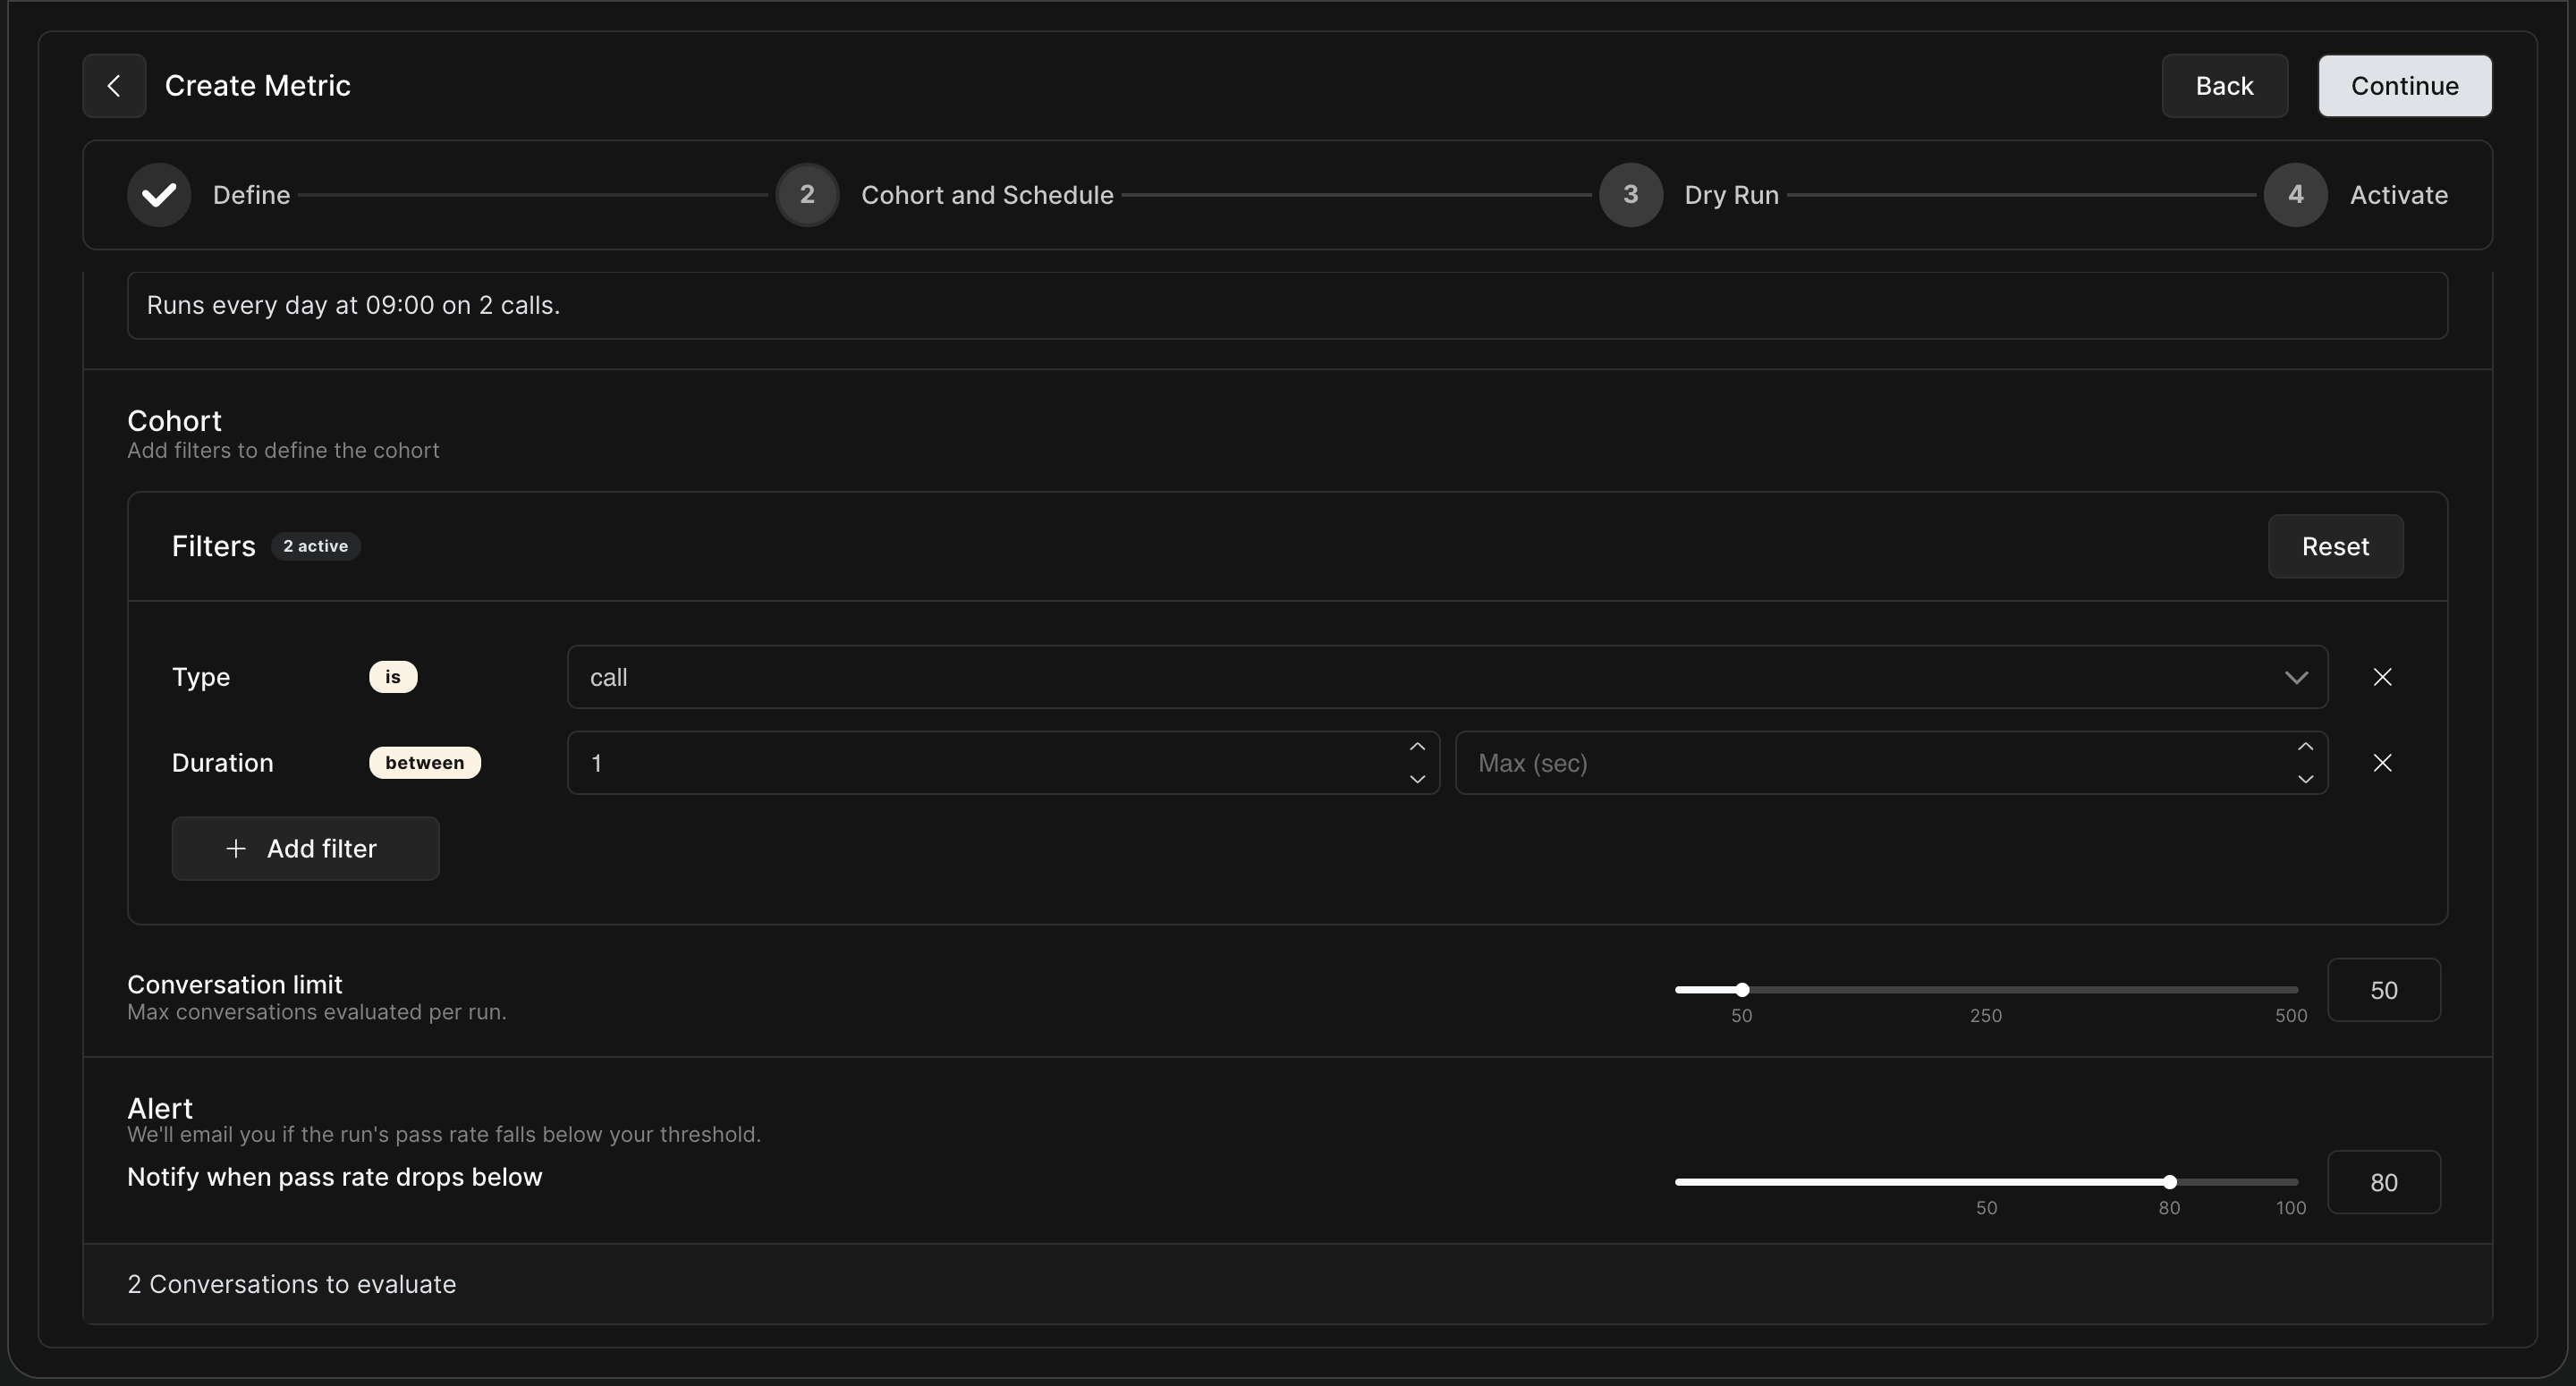
Define which calls to evaluate and when to run the evaluation.
-
Schedule: Set the cadence for the evaluation (e.g., runs every day at 09:00).
-
Cohort Filters: Narrow down the conversations you want to evaluate. You can filter by Type (e.g.,
is call), Duration, and more. -
Conversation Limit: Cap the maximum number of conversations evaluated per run to manage costs and volume (e.g., 50 calls).
-
Alert: Set a notification threshold. For example, if the pass rate drops below 80%, HoomanLabs will email you.
Step 3: Dry Run
Before deploying your metric to production, it is crucial to test it on a sample of real data to ensure the LLM judge is evaluating correctly.
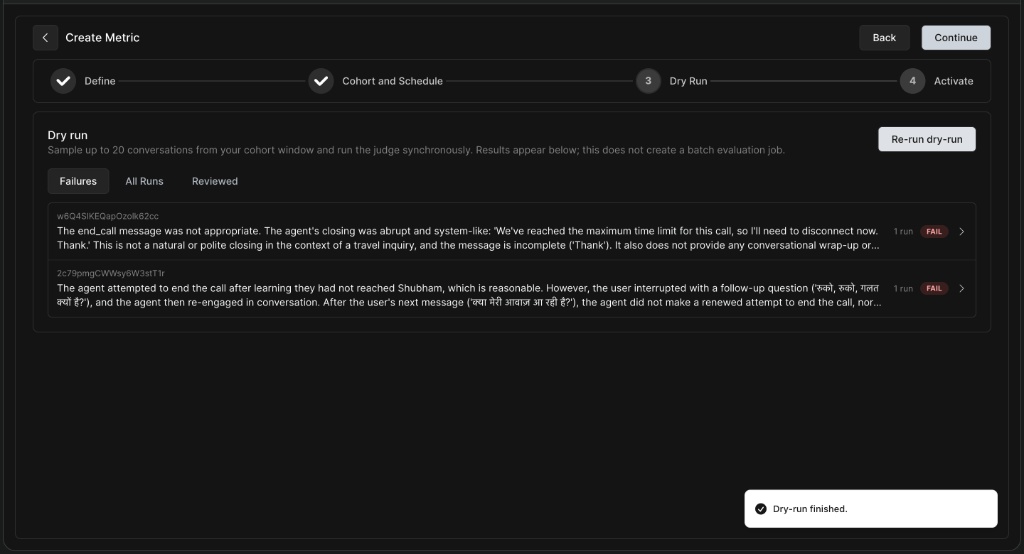
Dry Run Results
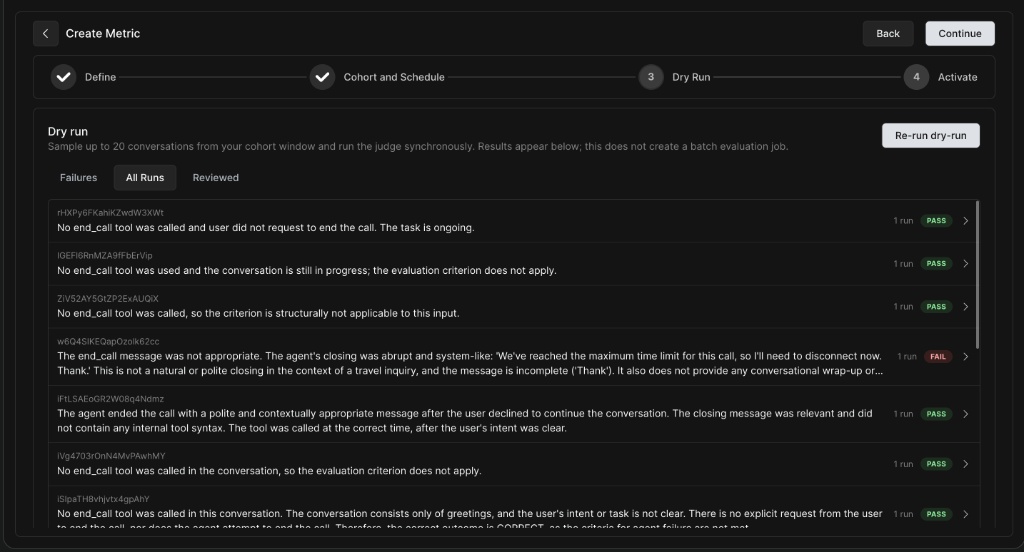
Investigating a Dry Run Result
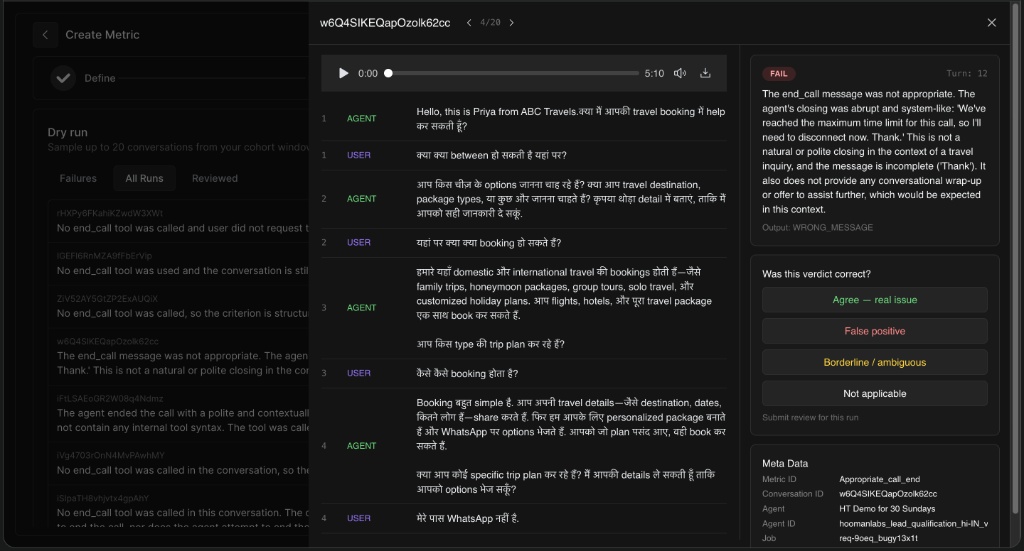
-
Clicking into a specific run allows you to view the audio player and the turn-by-turn transcript.
-
On the right panel, you can read the judge's specific reason for failure and the exact Output value it selected.
-
Feedback Mechanism: You can flag whether the verdict was correct by selecting Agree - real issue, False positive, Borderline / ambiguous, or Not applicable. This helps fine-tune your prompts.
Step 4: Review & Activate
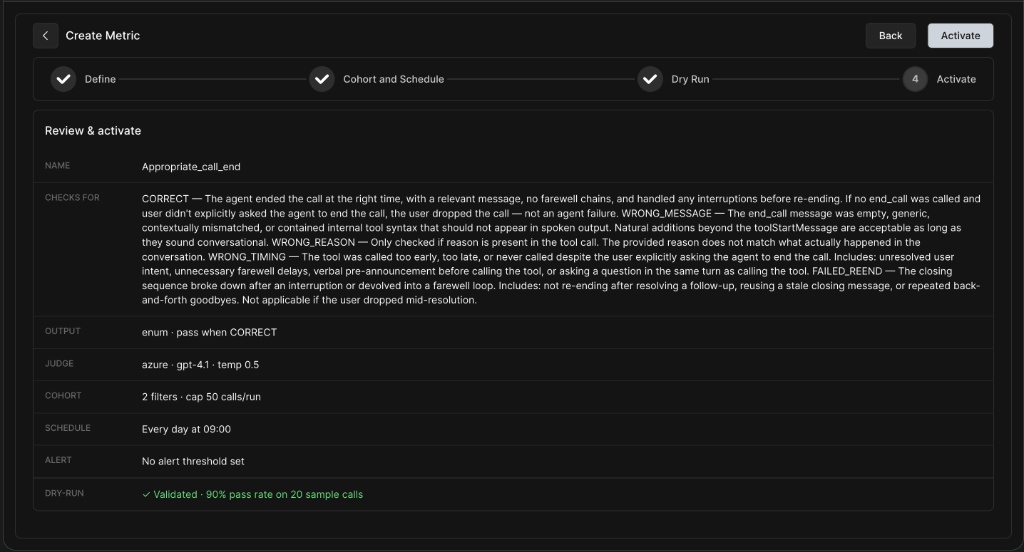
The final step is to review all your settings before making the metric live.
-
Ensure your prompt logic, cohort filters, schedule, and alert thresholds are correct.
-
Verify your Dry Run validation score (e.g., Validated - 90% pass rate on 20 sample calls).
-
Click Activate to deploy the metric.
-
If you are not satisfied with the dry run validation, go back using the back button to edit the metric.
Managing Metrics
Once metrics are created, you can easily manage them directly from the QA Overview dashboard.
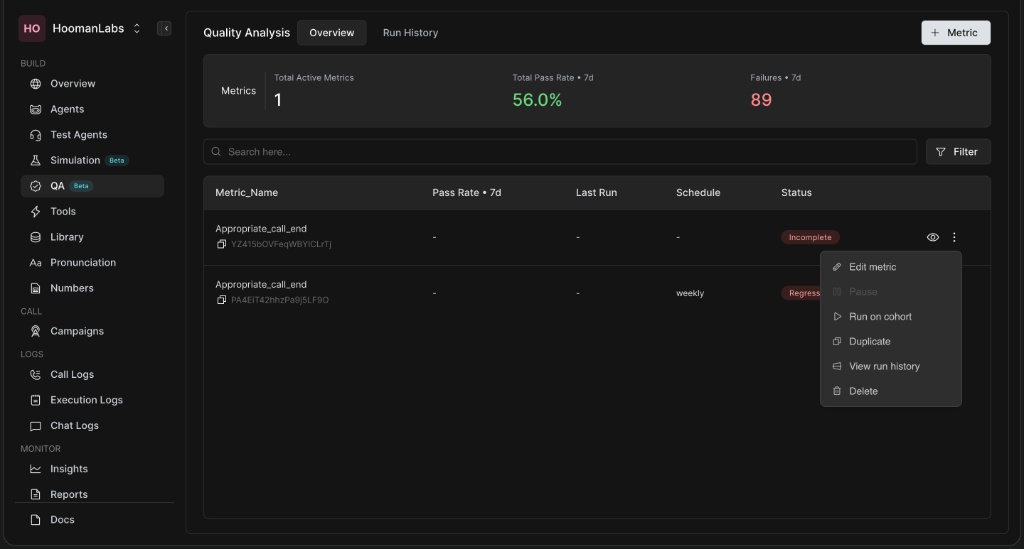
Click the three-dot menu ⋮ next to any metric to access the following options:
-
Edit metric: Modify the prompt, schedule, or cohort settings.
-
Pause: Temporarily stop the metric from running.
-
Run on cohort: Manually trigger a batch run outside of its normal schedule.
-
Duplicate: Clone the metric to use as a template for a new one.
-
View run history: See a detailed breakdown of all past executions.
-
Delete: Permanently remove the metric.
Running a Metric on a Cohort Manually
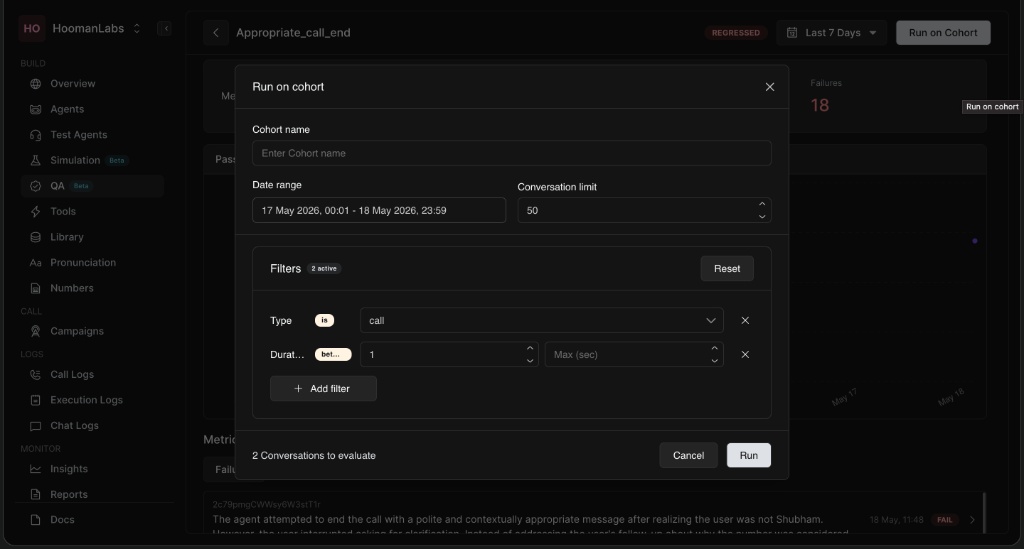
Sometimes you need to run an evaluation immediately over a specific date range rather than waiting for a scheduled run.
-
Select Run on cohort from the metric's action menu.
-
Enter a Cohort name for tracking.
-
Select the Date range you wish to evaluate.
-
Set the Conversation limit.
-
Adjust any Filters (like call duration or type).
-
Click Run to initiate the batch evaluation.
Monitoring Performance & Run History
To ensure continuous improvement, you can dive deep into how a specific metric is performing over time.
Metric Detail View
-
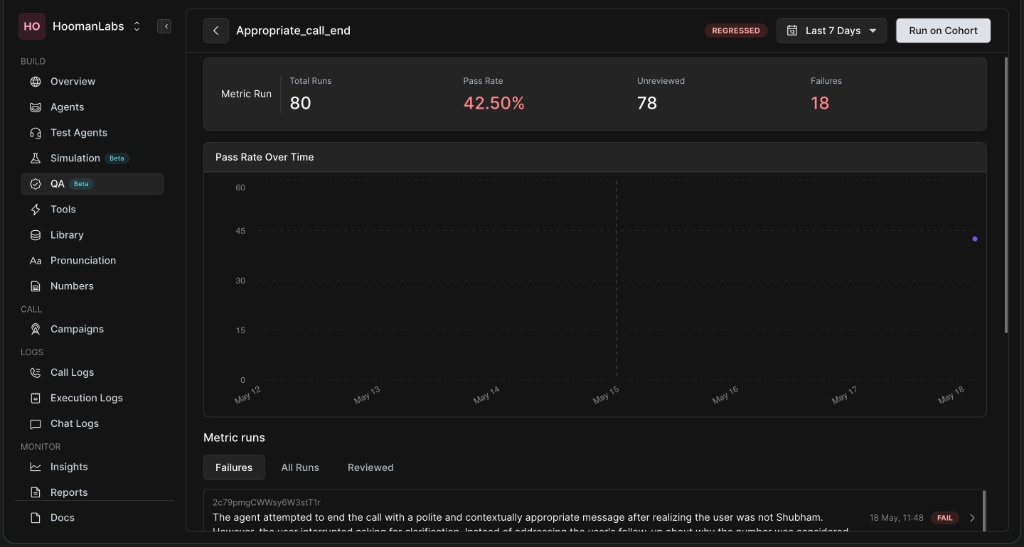
Pass Rate Over Time: A graphical representation of how your agents are scoring against this specific metric day-by-day.
-
Metric Runs Tab: Allows you to filter specific conversations by Failures, All Runs, and Reviewed calls to quickly identify recurring issues.
Run History Tab
-
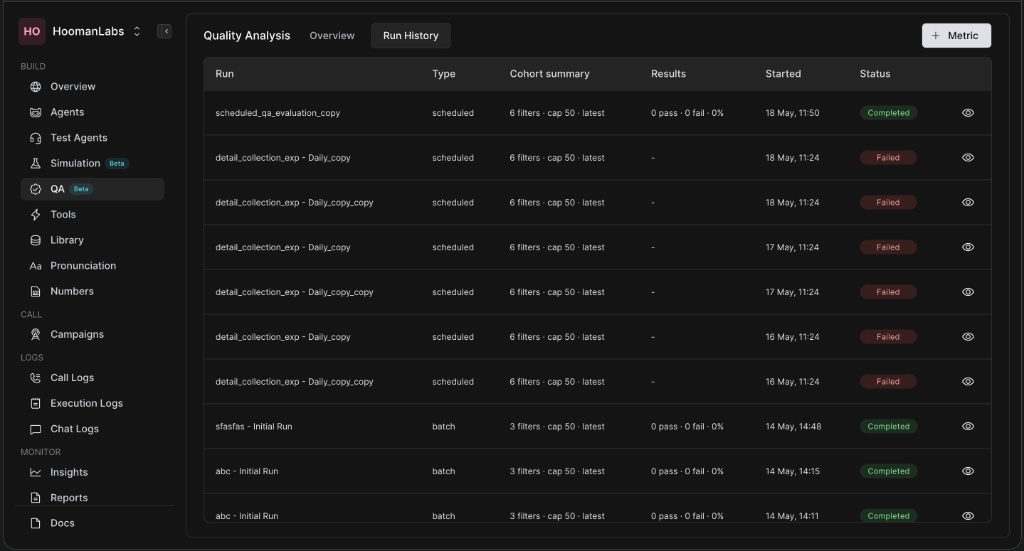
Access the Run History tab next to the Overview to see a log of all executed evaluation batches.
-
This view categorizes runs by Type (scheduled vs. batch), shows the cohort summary, results (passes/fails), start time, and overall Status (e.g., Completed, Failed).