Execution Logs
Overview
The Execution Logs dashboard provides a detailed, real-time record of all tool calls, API requests, RAG (Retrieval-Augmented Generation) queries, and internal system actions triggered by your agents. It is an essential tool for debugging, monitoring latency, and auditing agent performance.
The Execution Logs are organized into three distinct categories, each serving a specific role in tracking your agent's behavior:
-
Tools: This section is responsible for tracking actionable integrations. It logs every instance where your agent triggers a specific function or external action, such as booking an appointment, looking up available slots, or modifying a database entry. It helps you verify if your agent is passing the correct arguments and successfully executing tasks.
-
API: This section monitors system-level communications and lifecycle events. It logs webhooks and backend events, such as when a call is initiated, successfully connected, or disconnected (e.g.,
call-endorcall-end-not-connected). It is primarily used to track the stability and connectivity of the agent's communication channels. -
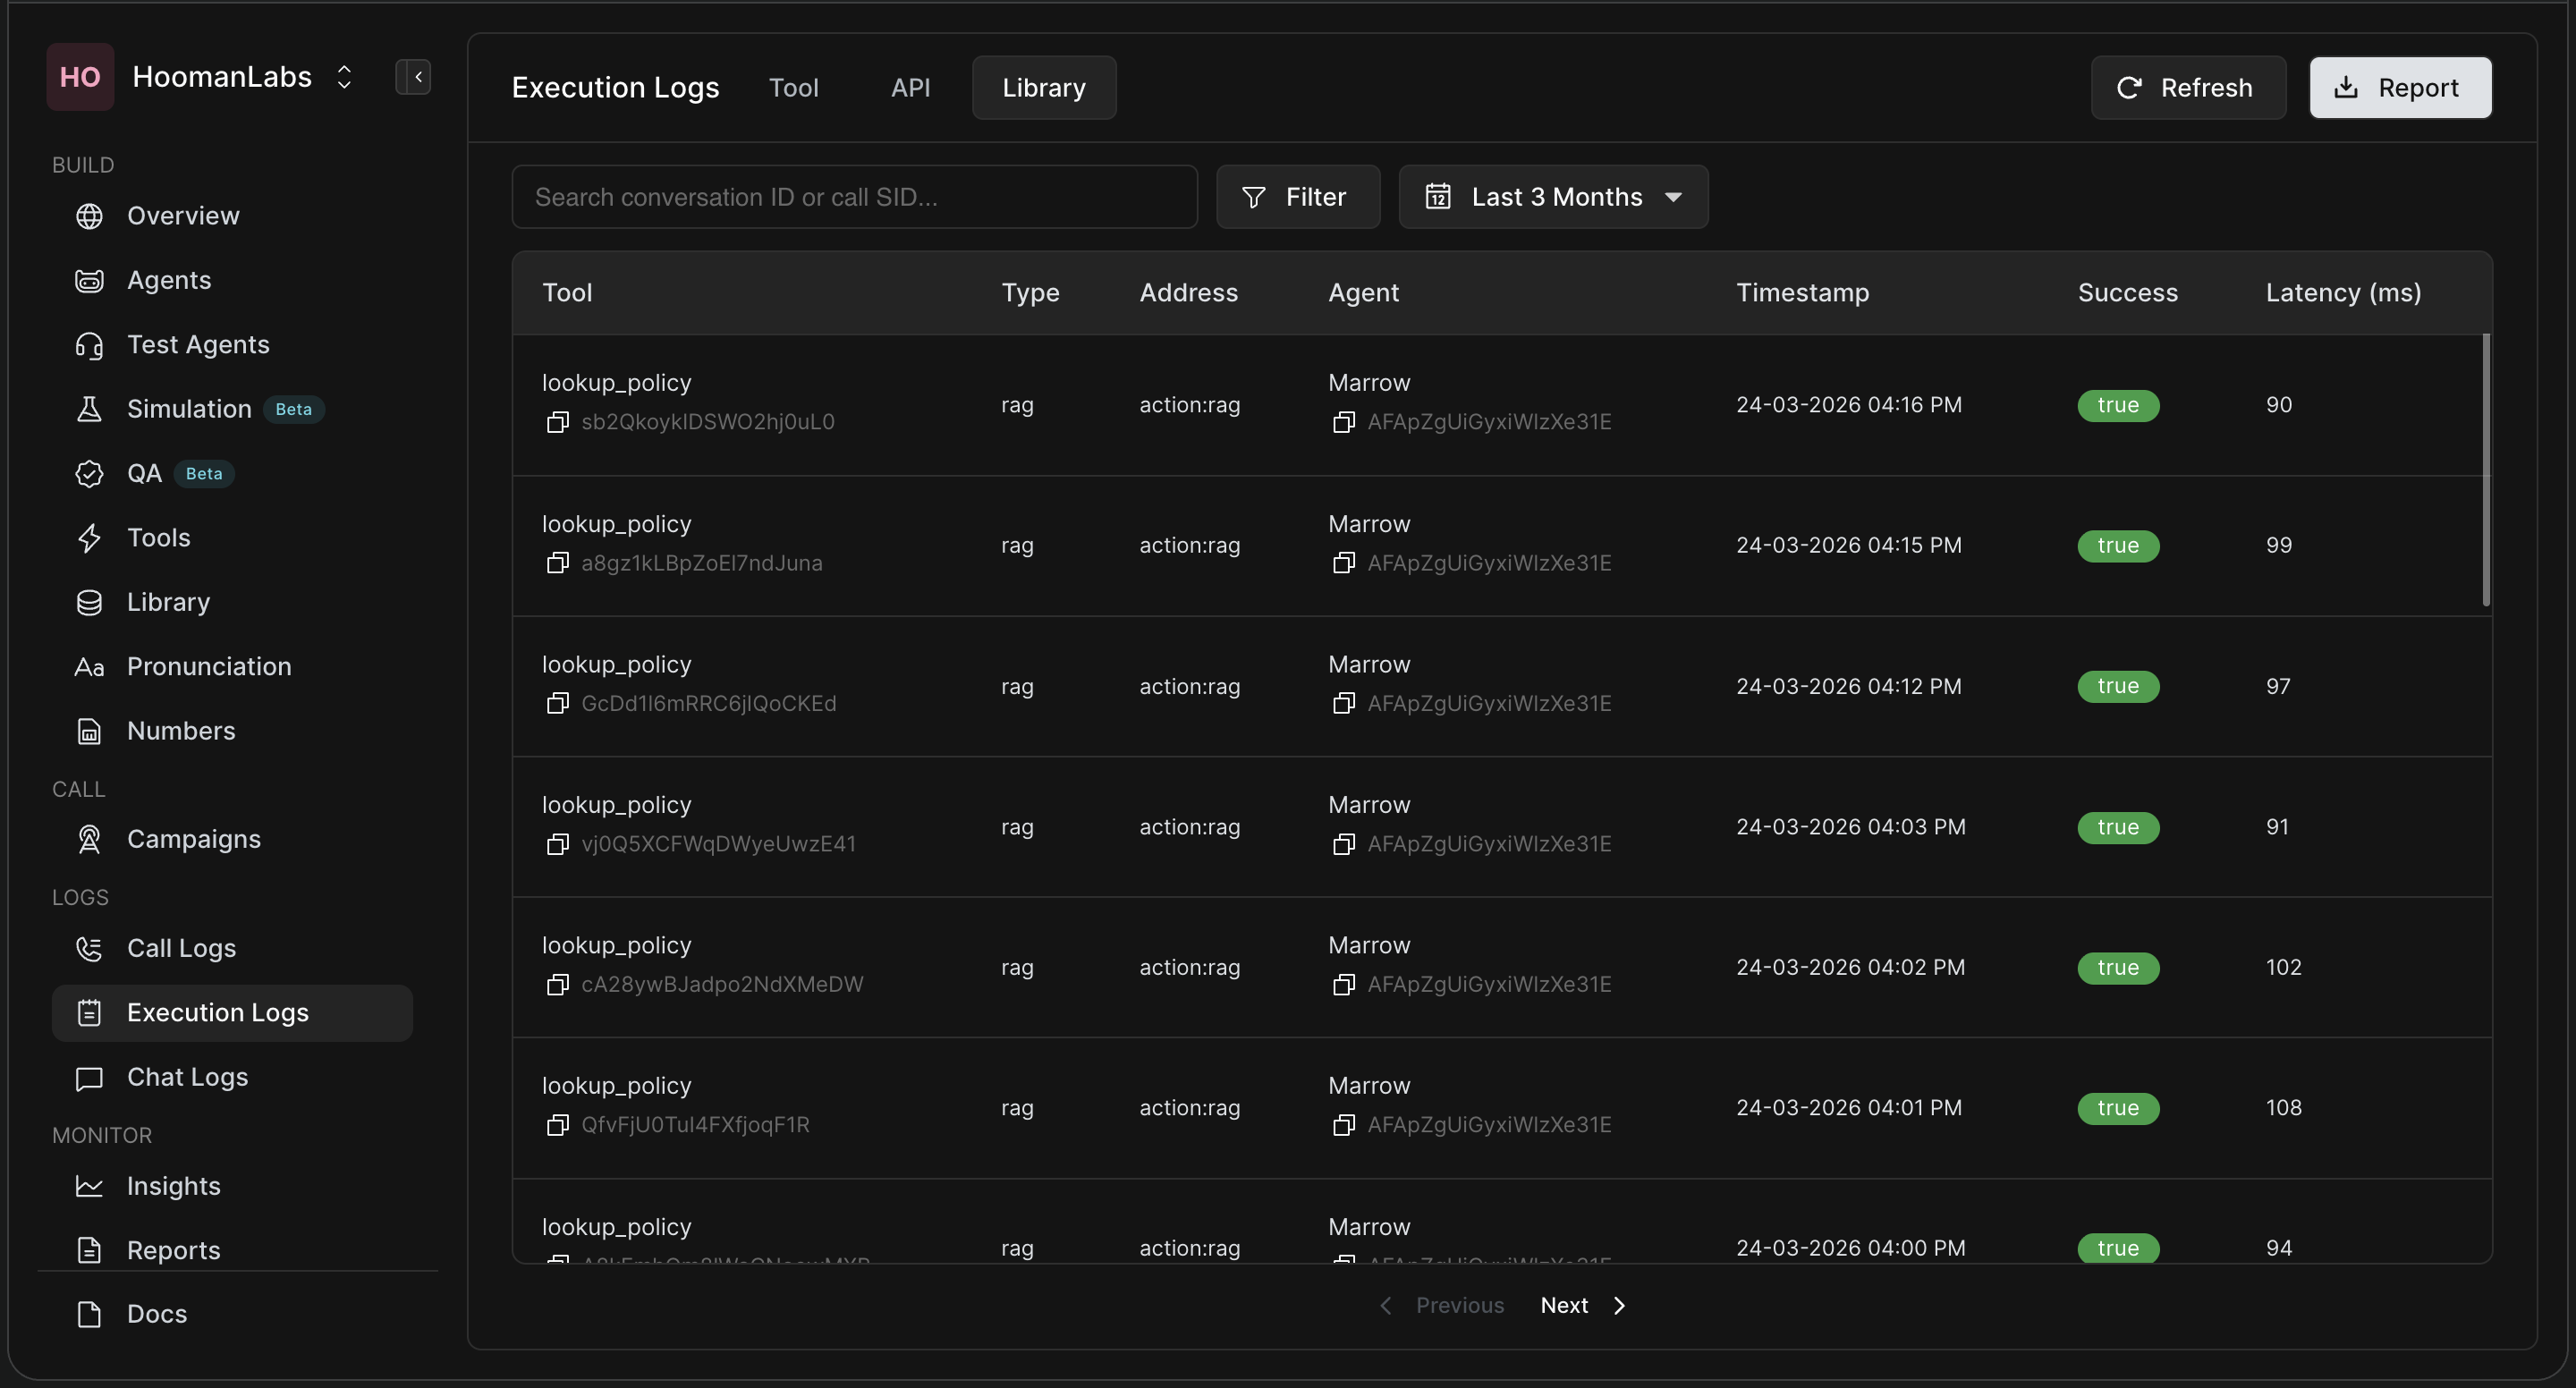
Library: This section focuses exclusively on knowledge retrieval (RAG). It logs internal actions where the agent consults your uploaded policies, documents, or knowledge bases to formulate an answer (e.g.,
lookup_policy). This is vital for monitoring how quickly and accurately your agent is retrieving information to answer user queries.
1. Dashboard Interface
The main dashboard presents a tabular view of all executions.
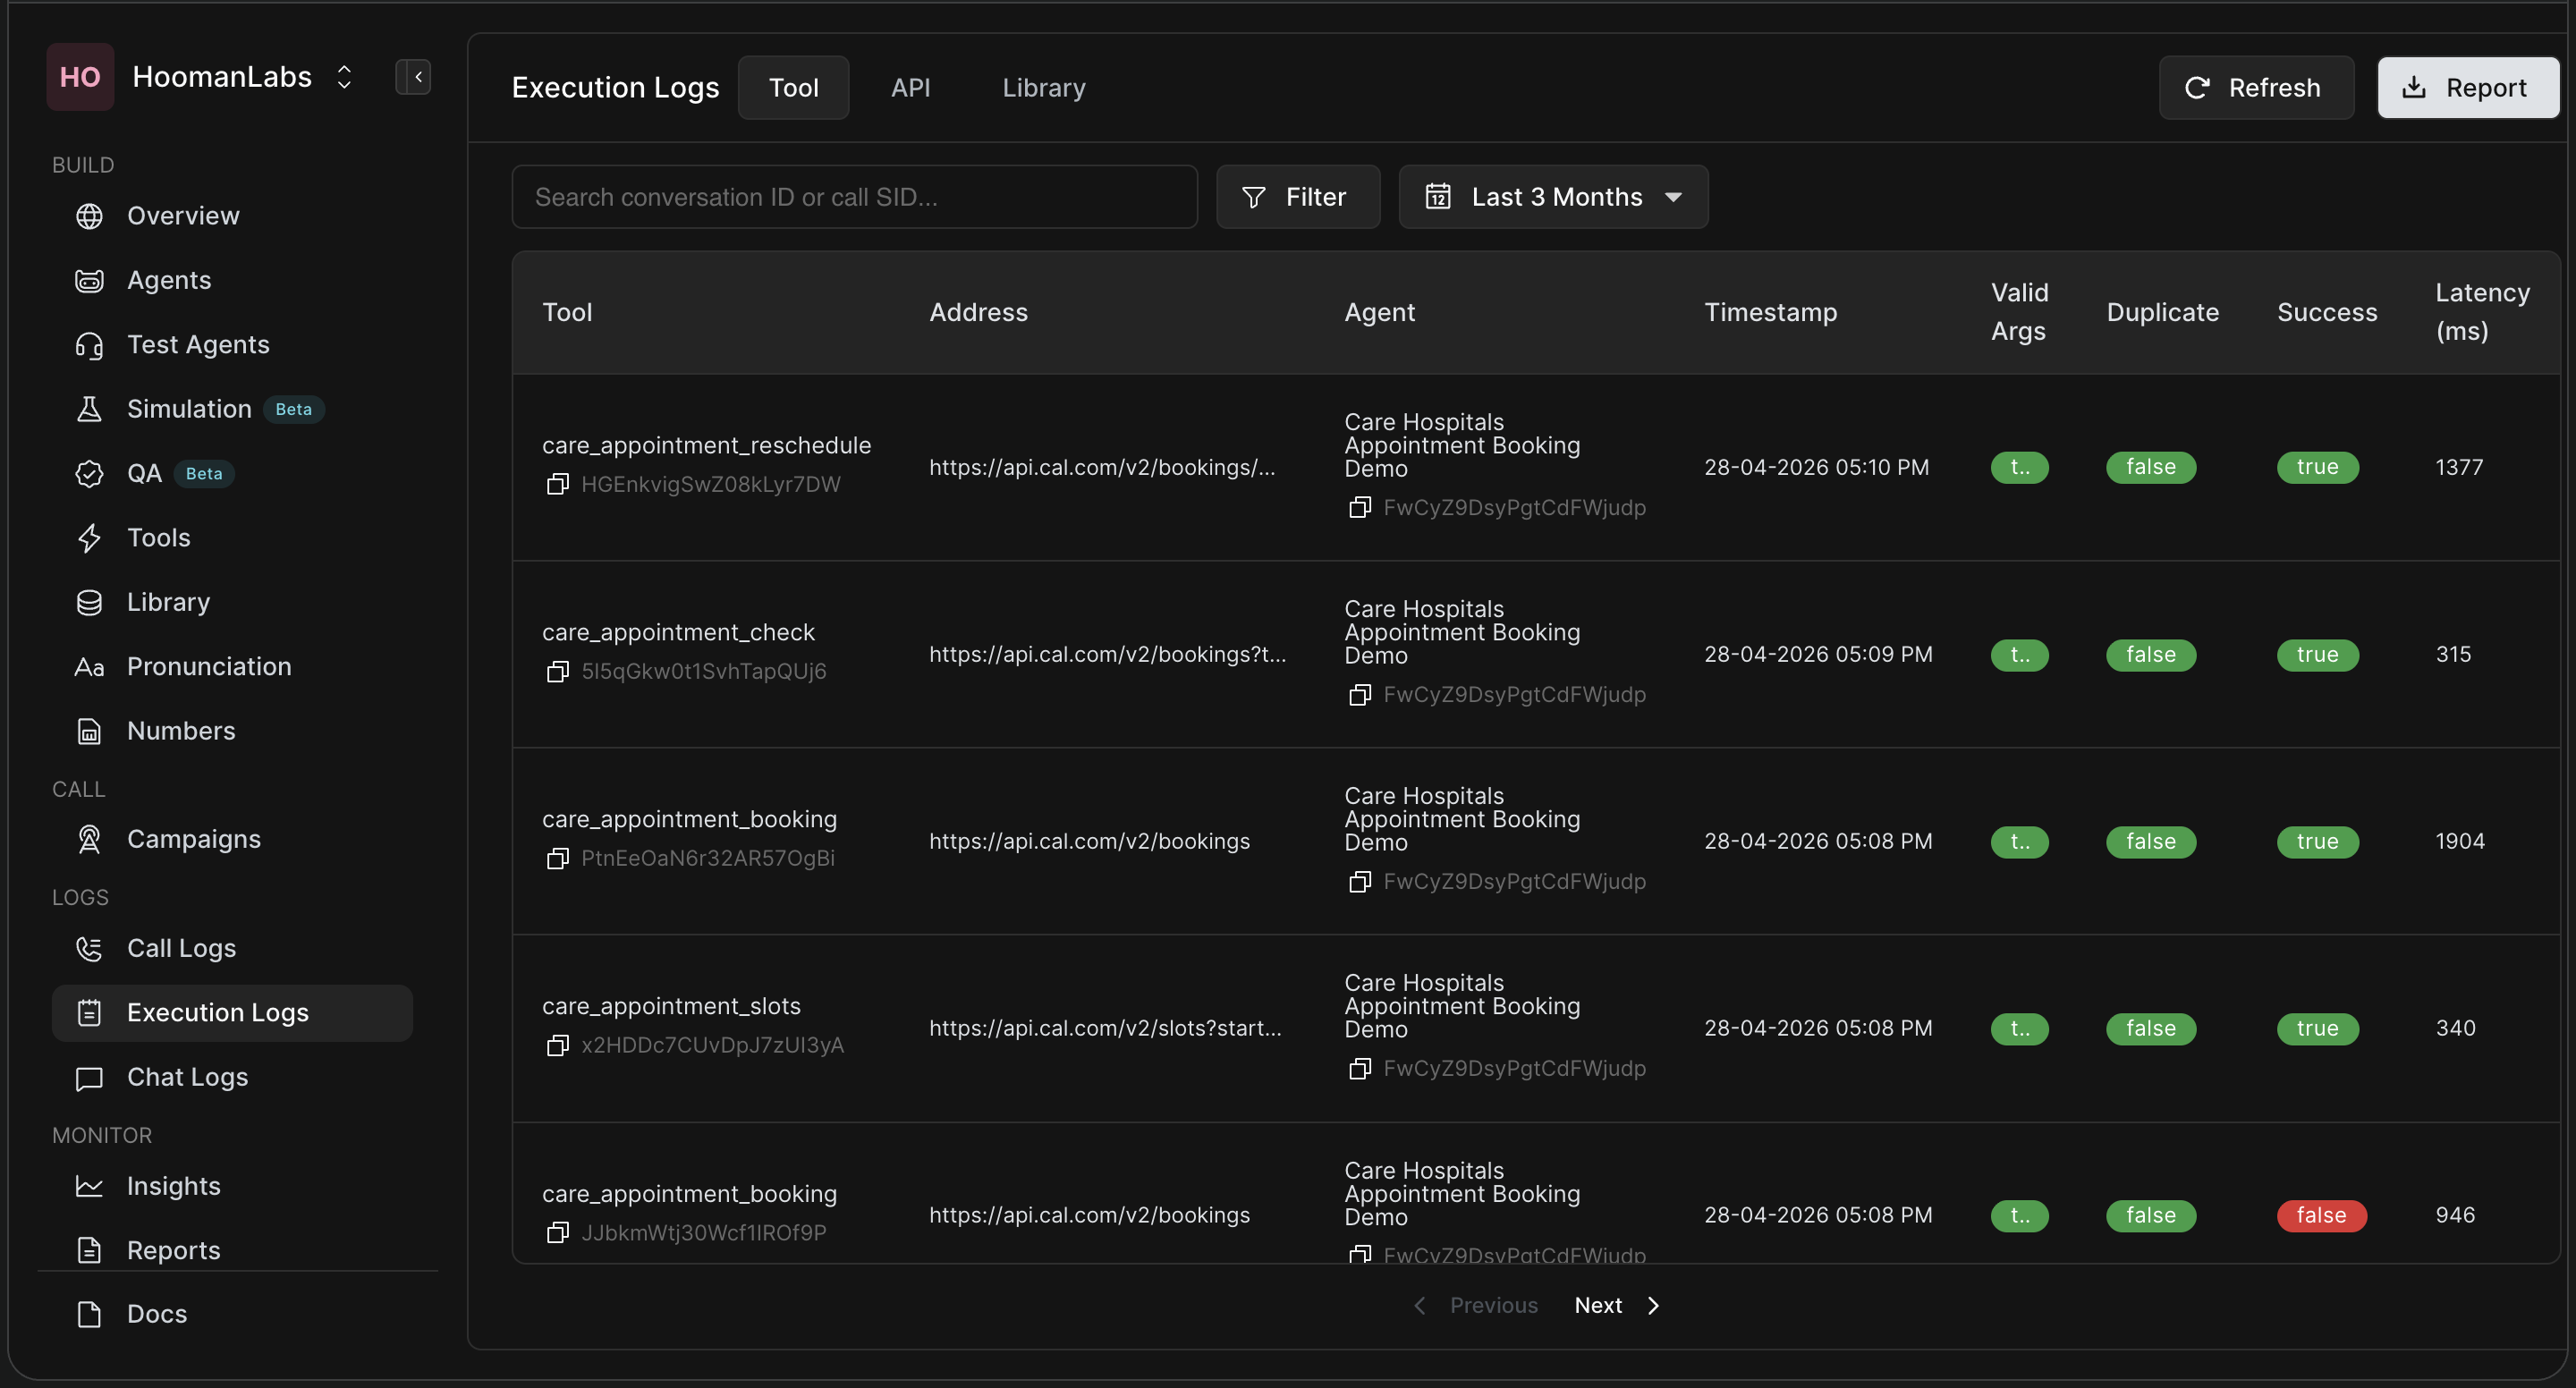
The table includes the following key columns:
-
Tool: The specific name of the tool or action executed (e.g.,
care_appointment_reschedule,lookup_policy,call-end). -
Type: The category of the execution (e.g.,
rag,call-end,llm). -
Address: The endpoint URL or system action reference used during the execution.
-
Agent: The name of the agent that triggered the execution.
-
Timestamp: The exact date and time the execution occurred.
-
Valid Args / Duplicate: Badges indicating if the arguments passed were valid and if the call was a duplicate.
-
Success: A green
trueor redfalsebadge indicating whether the execution completed successfully. -
Latency (ms): The time taken for the execution to complete, measured in milliseconds.
2. Searching and Filtering
To find specific logs efficiently, use the top navigation bar tools.
-
Search Bar: You can search for specific logs by pasting a conversation ID or call SID.
-
Filter Button: Click the filter icon to drill down by specific tools, agents, or success states.
-
Date Range Selector: By default, this may be set to "Last 7 Days." Click it to narrow down the time frame (e.g., Today, Last 3 Months, or a custom range).
3. Inspecting Execution Details
For deep diagnostics and debugging, you can view the complete payload of any individual execution log.
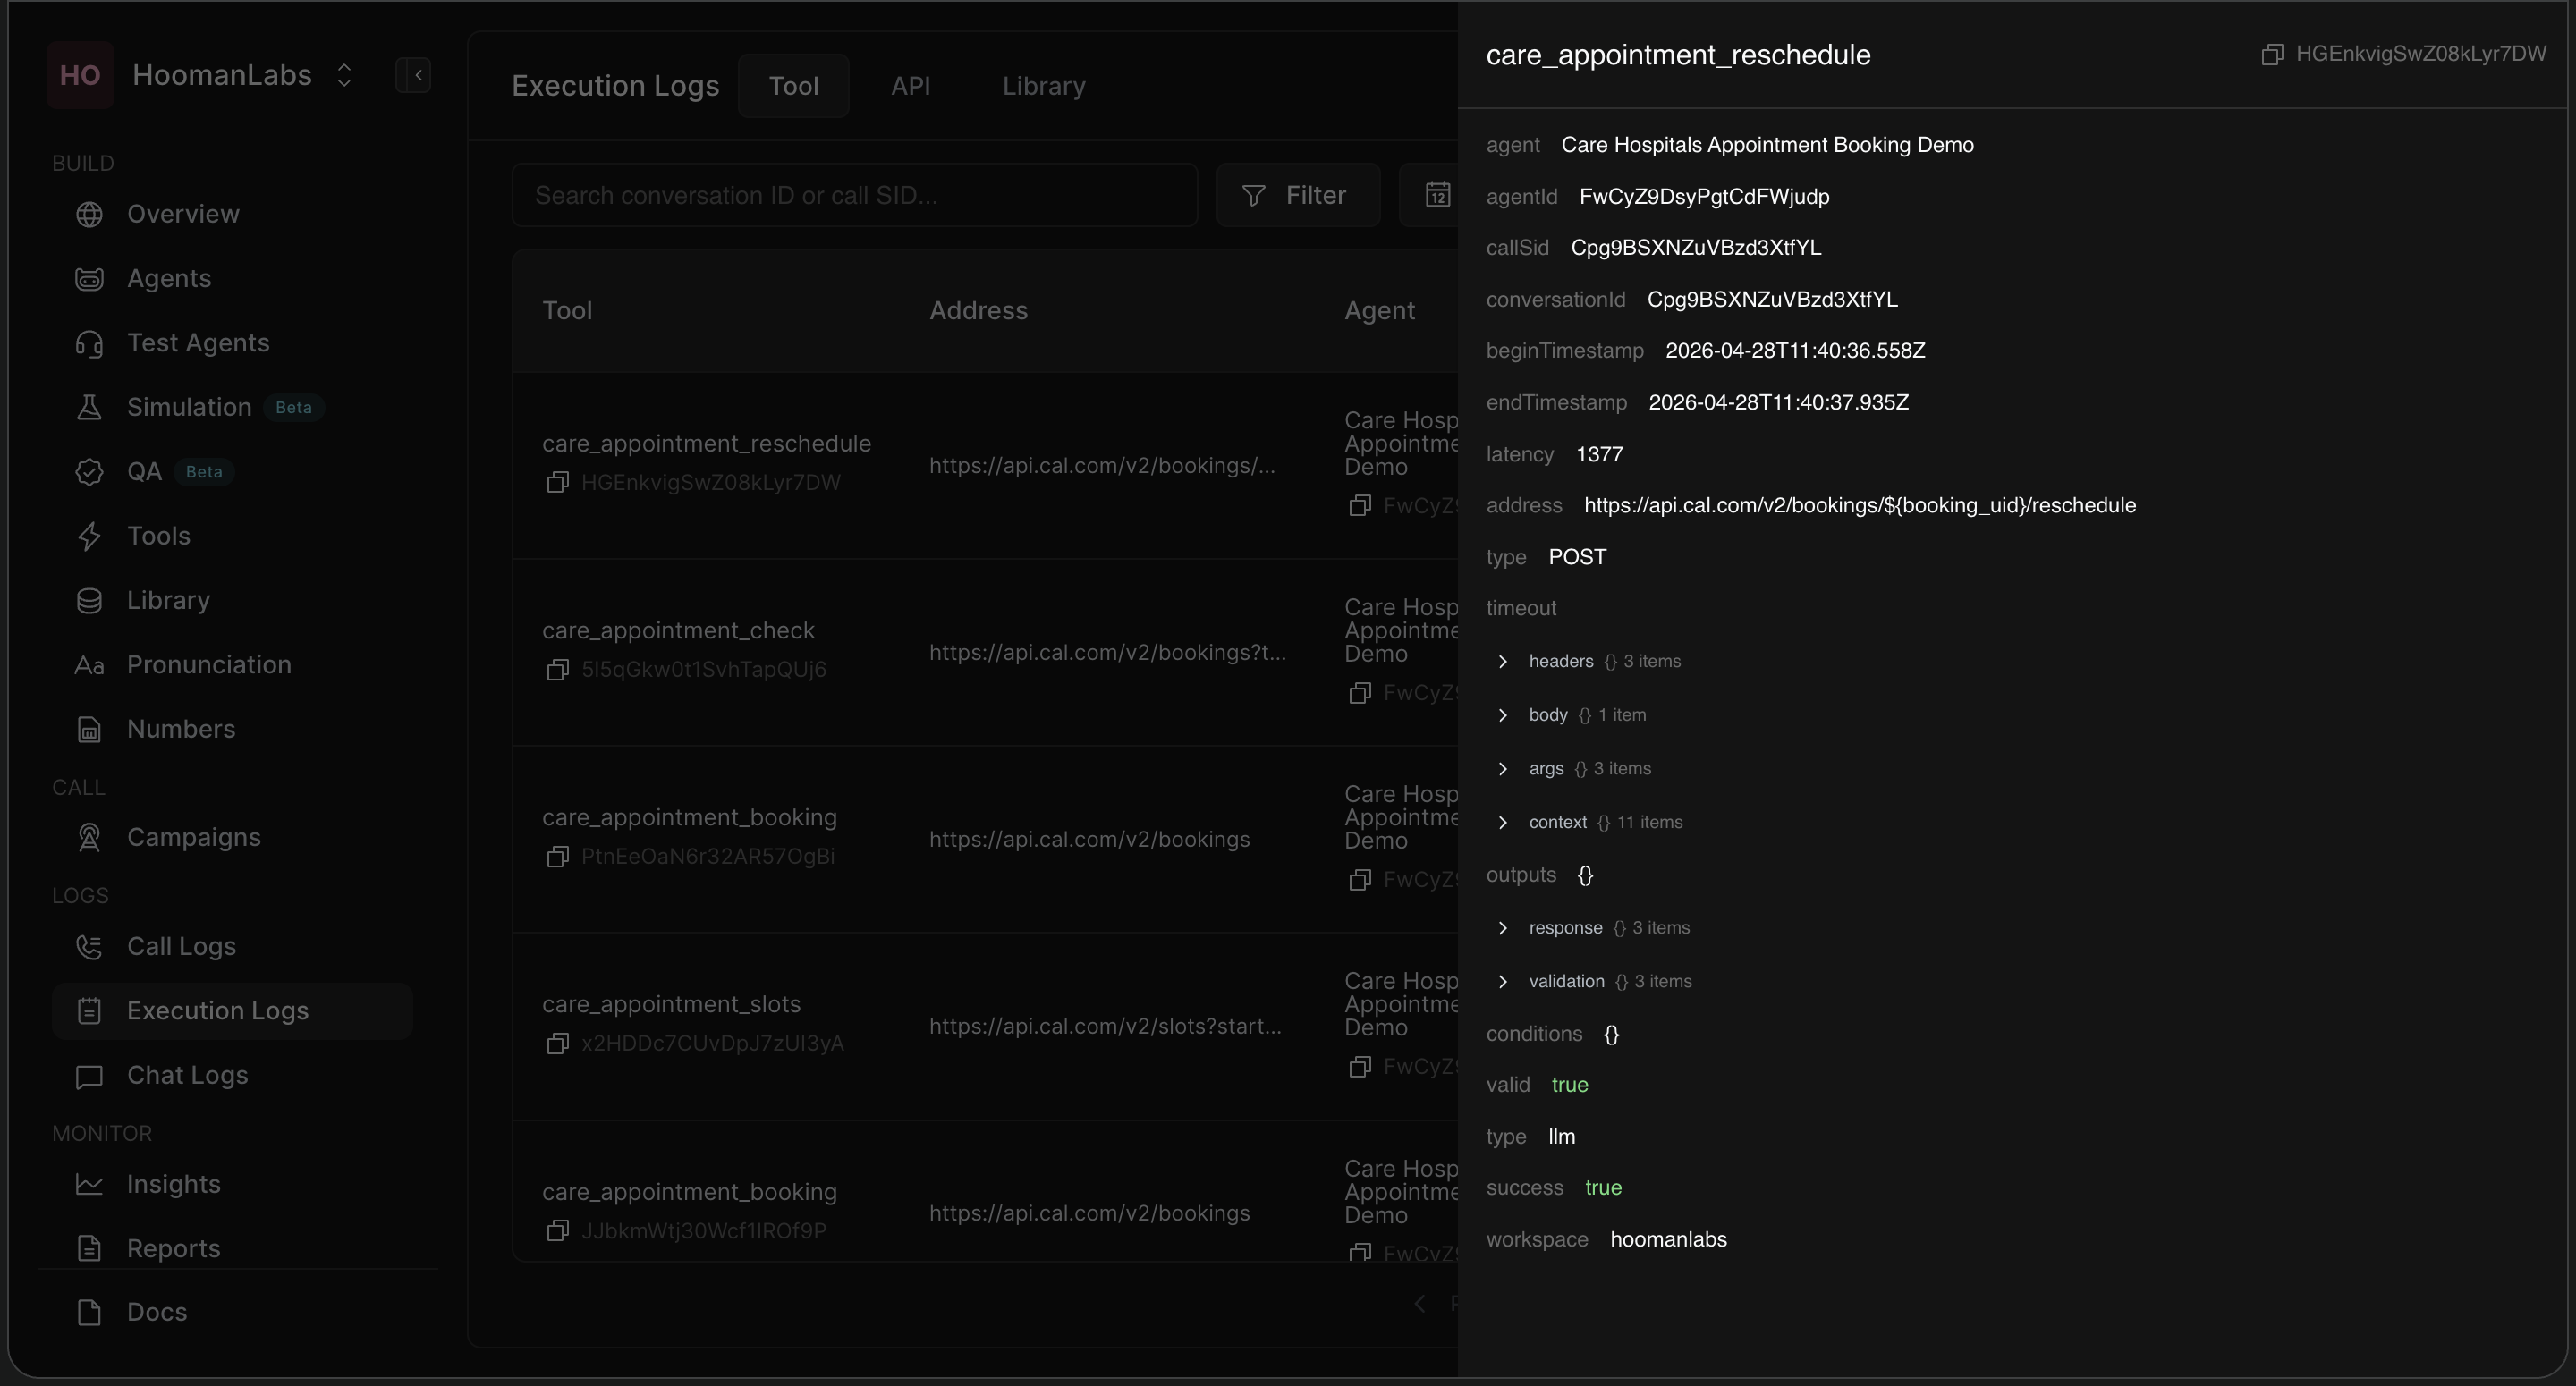
Clicking on any row in the table opens a side panel on the right. This panel contains granular details, including:
-
Identifiers:
agentId,callSid, andconversationId. -
Timing:
beginTimestampandendTimestamp. -
Request Details: Expandable JSON menus for
headers,body,args, andcontext. -
Response Details: Expandable JSON menus for
outputs,response, andvalidation. -
Status Flags:
valid,type, andsuccess.
If an execution fails (marked red false), open this panel and check the response and validation drop-downs to identify exactly what caused the error (e.g., a missing parameter or a 404 endpoint).
4. Exporting and Downloading Logs
If you need to analyze data externally or share it with your team, you can export the logs.
-
Click the Report (or Download) button in the top right corner.
-
A calendar modal will appear.
-
Select your desired start and end dates (e.g., 12/05/2026 - 19/05/2026).
-
Click Download to export the logs.
Frequently Asked Questions (FAQ)
Q: How do I find out why a specific API tool call failed?
A: Look for the log entry with a red false badge in the Success column. Click on that row to open the side panel. Expand the response and body sections to read the exact error message returned by the external API.
Q: Can I monitor how fast my RAG (knowledge base) queries are performing?
A: Yes. You can scroll through or filter the logs for tools typed as rag (e.g., lookup_policy). Check the Latency (ms) column to see how quickly the system is retrieving context. Anything consistently over 1000ms might warrant optimisation.
Q: What does the "call-end" tool mean?
A: "call-end" and "call-end-not-connected" are system-level execution logs. They indicate the final status of an agent's interaction, showing when a call was officially terminated and whether a connection was successfully established beforehand.
Q: What is the difference between "Valid Args" and "Success"?
A: "Valid Args" means the agent successfully generated the correct parameters required by the tool (e.g., it extracted the right date and time for an appointment). "Success" means the external API or system actually accepted those arguments and completed the action without throwing an error. A log can have valid arguments but still fail if the external server is down.
Q: How far back can I search my logs?
A: You can use the date picker to search historical logs. The standard quick filter allows you to view up to the "Last 3 Months," but you can use the custom calendar tool for specific date ranges depending on your workspace's data retention policy.