Quality Analysis (QA)
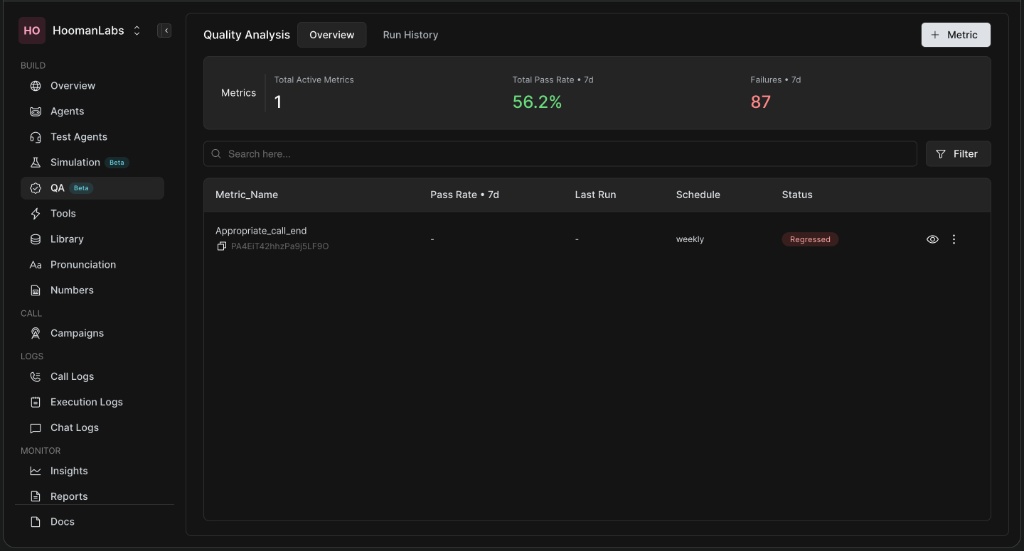
Overview
The QA module empowers you to automatically evaluate your AI agents' call transcripts against custom-defined metrics. By leveraging LLM-based judges, you can monitor conversation quality, identify regressions, and ensure your agents adhere to specific guidelines and best practices.
Key Elements:
-
Total Active Metrics: The number of metrics currently running.
-
Total Pass Rate: The aggregated pass rate across all metrics over a specified timeframe (e.g., 7 days).
-
Failures: The total number of failed evaluations.
-
Metrics Table: A quick view of each metric's pass rate, last run schedule, and current status (e.g., Regressed).
Creating a New Metric
To evaluate a specific behavior (e.g., "Appropriate Call End"), you need to create a metric. The creation process is divided into four distinct steps.
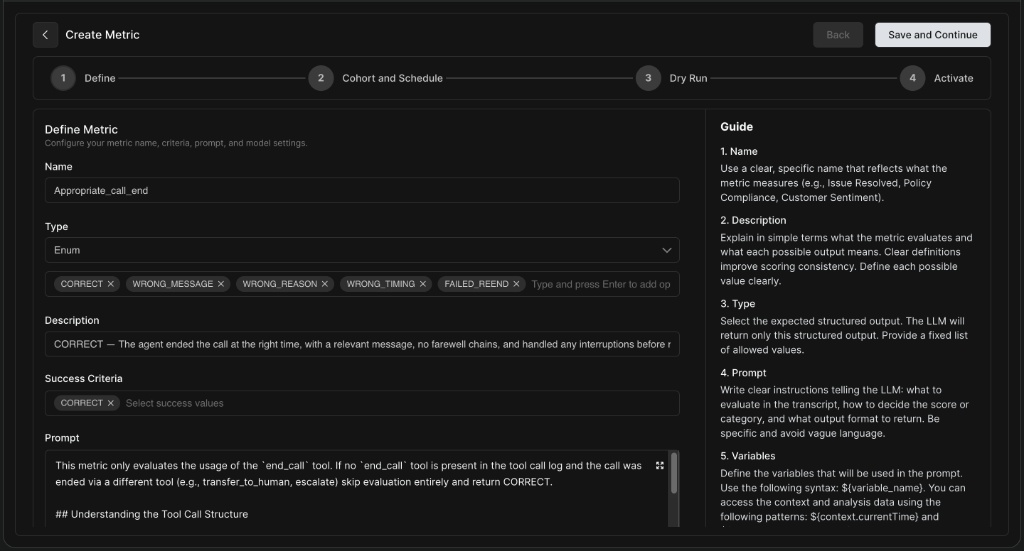
Step 1: Define
The Define step is where you tell the LLM exactly what to evaluate.
-
Name & Description: Give your metric a clear, identifiable name and explain what it evaluates to ensure scoring consistency.
-
Type: Select the expected structured output. For categorical evaluations, use Enum.
-
Enum Options: Define the possible output values (e.g.,
CORRECT,WRONG_MESSAGE,WRONG_TIMING). -
Success Criteria: Specify which of your Enum values constitute a "pass" or successful interaction.
-
Prompt: Write clear instructions telling the LLM what to look for in the transcript and how to decide the score. You can use provided variables like
${variable_name}to inject context dynamically.
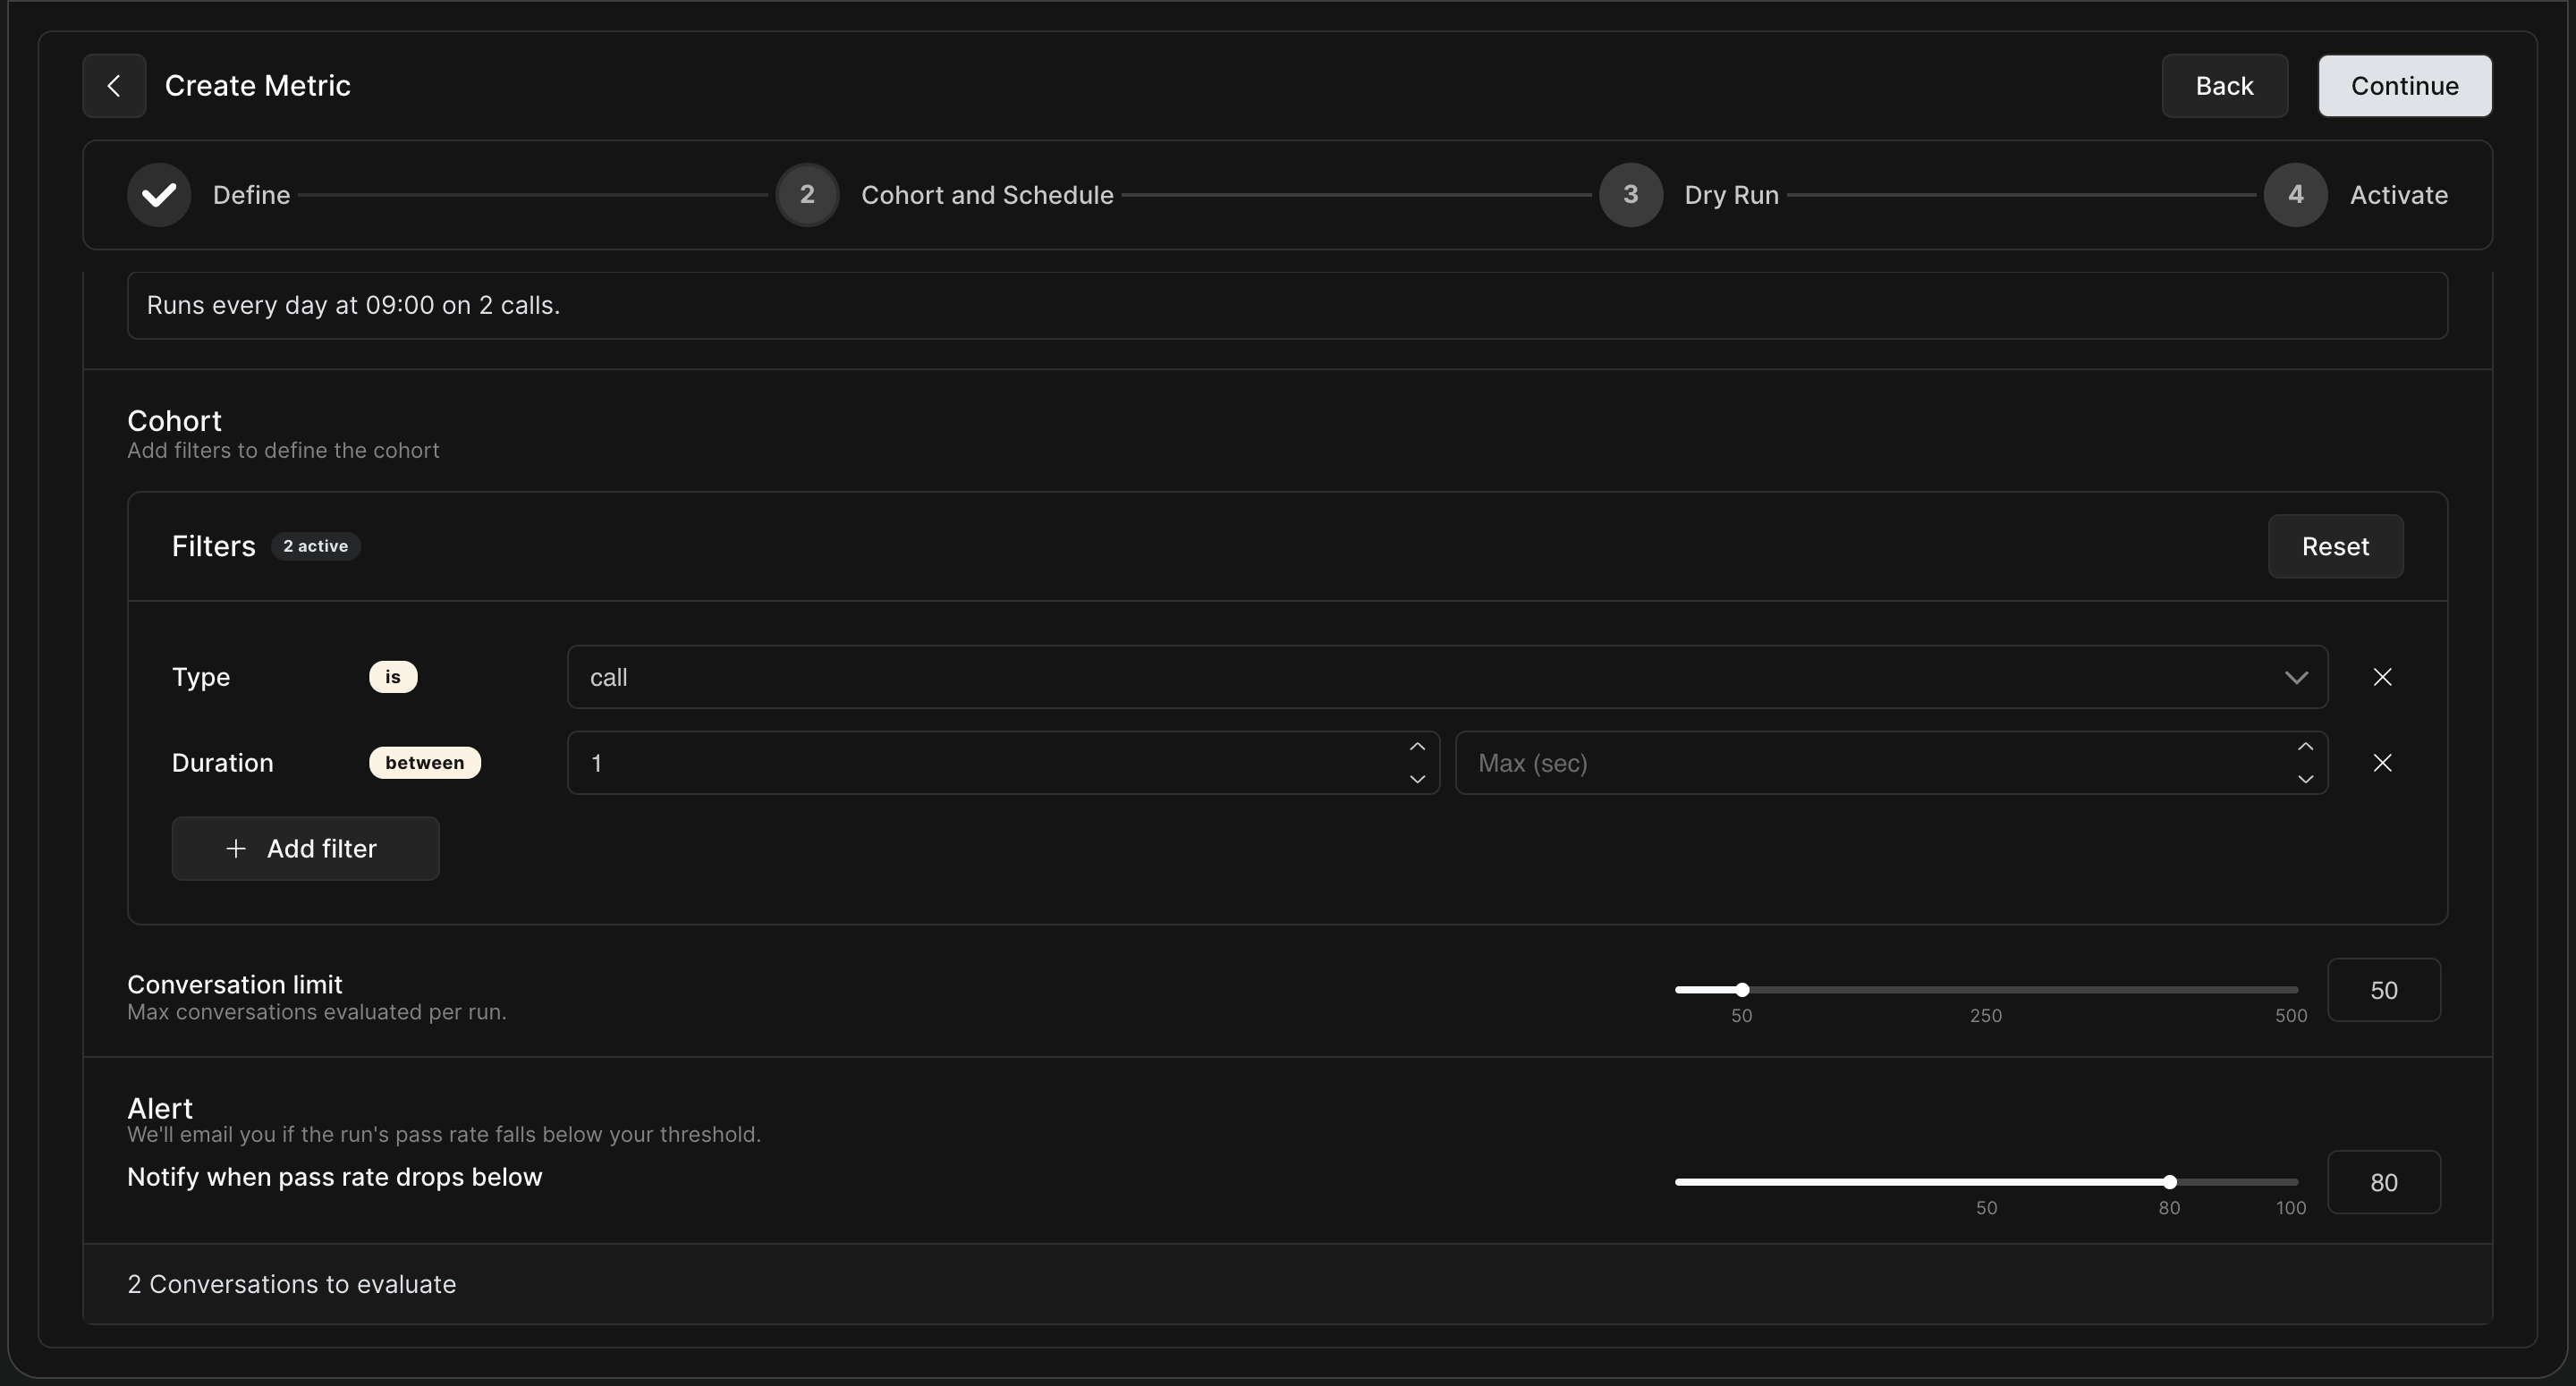
Step 2: Cohort and Schedule
Define which calls to evaluate and when to run the evaluation.
-
Schedule: Set the cadence for the evaluation (e.g., runs every day at 09:00).
-
Cohort Filters: Narrow down the conversations you want to evaluate. You can filter by Type (e.g.,
is call), Duration, and more. -
Conversation Limit: Cap the maximum number of conversations evaluated per run to manage costs and volume (e.g., 50 calls).
-
Alert: Set a notification threshold. For example, if the pass rate drops below 80%, HoomanLabs will email you.
Step 3: Dry Run
Before deploying your metric to production, it is crucial to test it on a sample of real data to ensure the LLM judge is evaluating correctly.
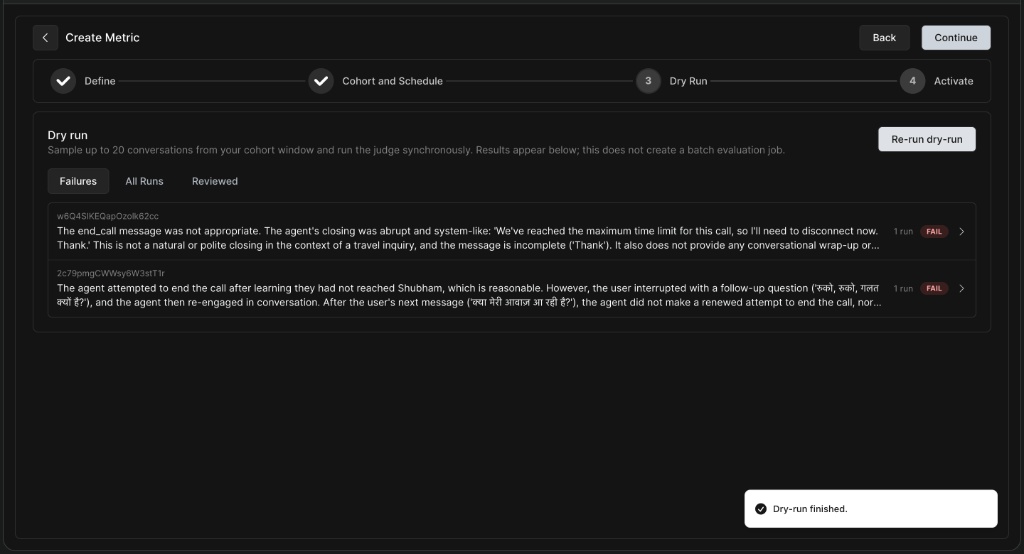
Dry Run Results
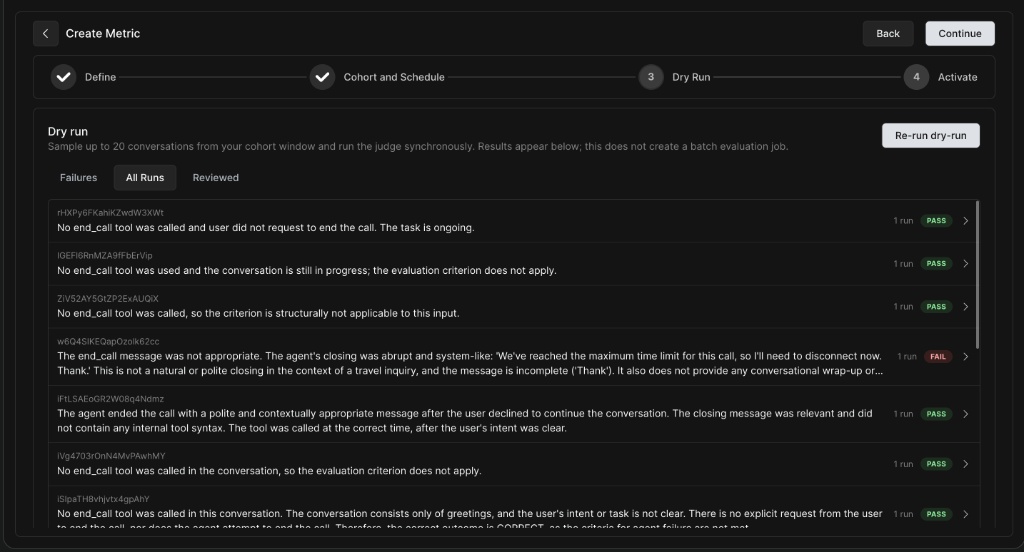
Investigating a Dry Run Result
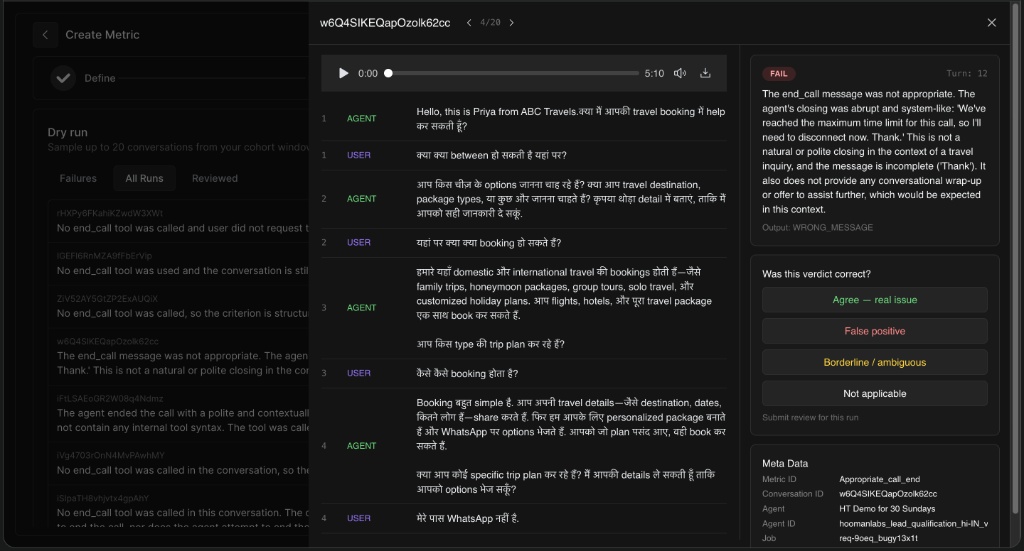
-
Clicking into a specific run allows you to view the audio player and the turn-by-turn transcript.
-
On the right panel, you can read the judge's specific reason for failure and the exact Output value it selected.
-
Feedback Mechanism: You can flag whether the verdict was correct by selecting Agree - real issue, False positive, Borderline / ambiguous, or Not applicable. This helps fine-tune your prompts.
Step 4: Review & Activate
The final step is to review all your settings before making the metric live.
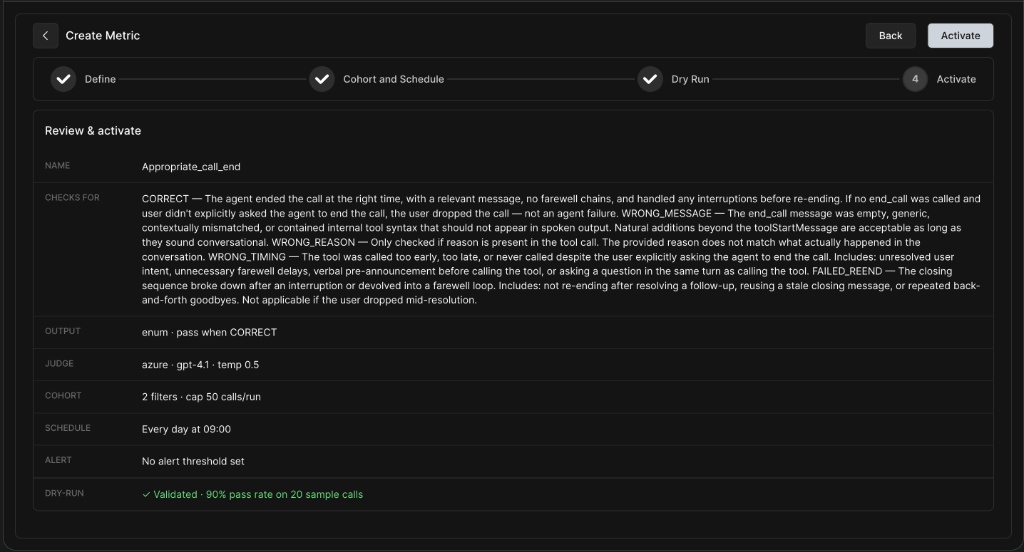
-
Ensure your prompt logic, cohort filters, schedule, and alert thresholds are correct.
-
Verify your Dry Run validation score (e.g., Validated - 90% pass rate on 20 sample calls).
-
Click Activate to deploy the metric.
Managing Metrics
Once metrics are created, you can easily manage them directly from the QA Overview dashboard.
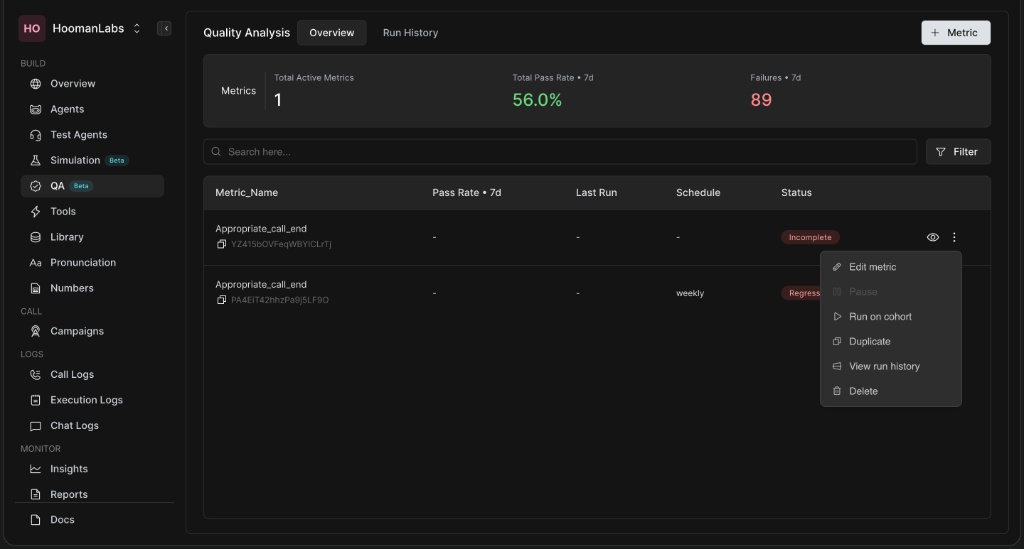
Click the three-dot menu ⋮ next to any metric to access the following options:
-
Edit metric: Modify the prompt, schedule, or cohort settings.
-
Pause: Temporarily stop the metric from running.
-
Run on cohort: Manually trigger a batch run outside of its normal schedule.
-
Duplicate: Clone the metric to use as a template for a new one.
-
View run history: See a detailed breakdown of all past executions.
-
Delete: Permanently remove the metric.
Running a Metric on a Cohort Manually
Sometimes you need to run an evaluation immediately over a specific date range rather than waiting for a scheduled run.
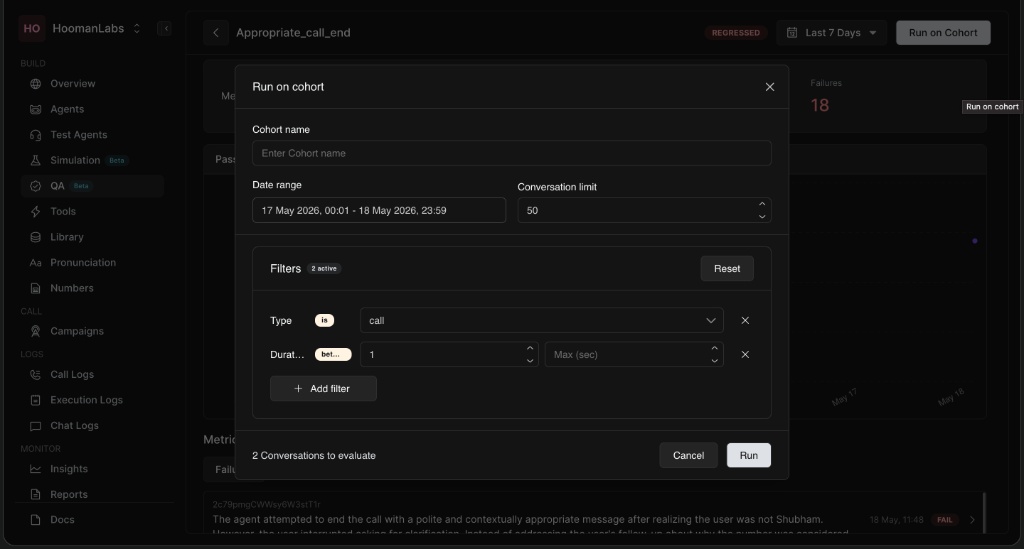
-
Select Run on cohort from the metric's action menu.
-
Enter a Cohort name for tracking.
-
Select the Date range you wish to evaluate.
-
Set the Conversation limit.
-
Adjust any Filters (like call duration or type).
-
Click Run to initiate the batch evaluation.
Monitoring Performance & Run History
To ensure continuous improvement, you can dive deep into how a specific metric is performing over time.
Metric Detail View
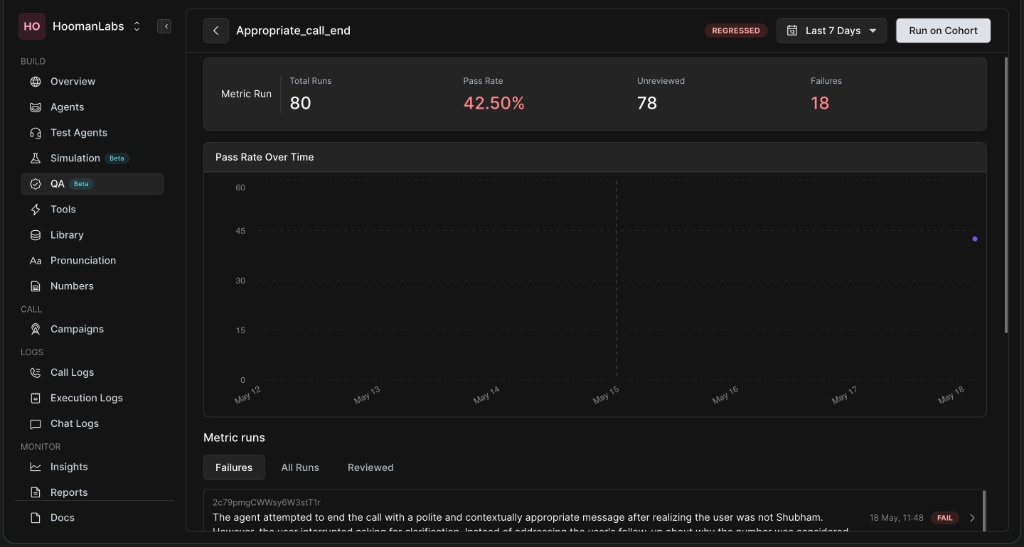
-
Pass Rate Over Time: A graphical representation of how your agents are scoring against this specific metric day-by-day.
-
Metric Runs Tab: Allows you to filter specific conversations by Failures, All Runs, and Reviewed calls to quickly identify recurring issues.
Run History Tab
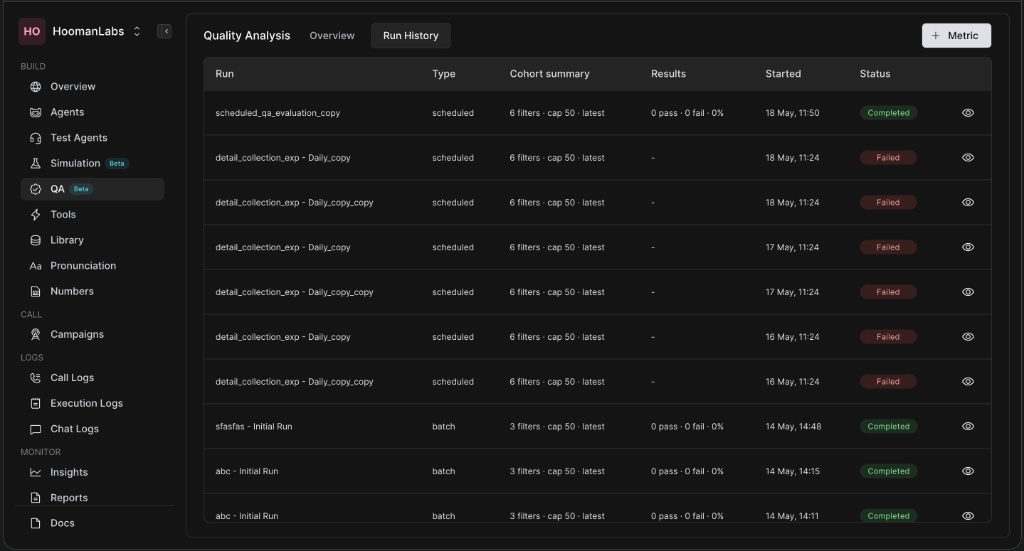
-
Access the Run History tab next to the Overview to see a log of all executed evaluation batches.
-
This view categorizes runs by Type (scheduled vs. batch), shows the cohort summary, results (passes/fails), start time, and overall Status (e.g., Completed, Failed).